
This is an old revision of the document!
Table of Contents
HATPRO (Humidity and Temperature Profiler) is a microwave radiometer remote sensing instrument detecting thermal emission from the atmosphere. We currently operate three HATPRO devices:
- SNOHAT at the Schneefernerhaus observatory (Mt. Zugspitze)
Introduction
The atmosphere in the microwave spectral range (MW) between 1 and 300 GHz is semi-transparent. This means its components like dry gases, water vapor, or hydrometeors interact with MW radiation but overall even the cloudy atmosphere is not completely opaque. Microwave radiometers are very sensitive receivers usually equipped with multiple receiver channels in order to derive the characteristic emission spectrum of the atmosphere. Microwave radiometers are utilized in a variety of environmental and engineering applications, including weather forecasting, climate monitoring, radio astronomy, monitoring of land and ocean surface properties.
For weather and climate monitoring, microwave radiometers are operated from space [1] [2] as well as from the ground [3]. As remote sensing instruments, they are designed to operate continuously and autonomously often in combination with other atmospheric remote sensors like for example cloud radars and lidars. They allow to derive important meteorological quantities such as vertical temperature and humidity profile, columnar water vapor amount, or columnar liquid water path with a high temporal resolution in the order of seconds to minutes under nearly all weather conditions.

RPG HATPRO-SUNHAT at the Barbados Clouds Observatory.
History of microwave radiometer measurements
The first operational microwave radiometer was designed by Robert H. Dicke in the Radiation Laboratory of Massachusetts Institute of Technology to better determine the temperature of the microwave background radiation. This first radiometer worked at a wavelength 1.25 cm and was operated at the Massachusetts Institute of Technology. Dicke also first discovered weak atmospheric absorption in the MW using three different radiometers (at wavelengths of 1.0, 1.25 and 1.5 cm) during his collaborative work with other scientists in Florida.
Soon after satellites were first used for observing the atmosphere, MW radiometers became part of their instrumentation. In 1962 the Mariner-2 mission was launched by NASA in order to investigate the surface of Venus including a MW radiometer for water vapor and temperature observations. In following years a wide variety of MW radiometers were tested on satellites. The launch of the Scanning Multichannel Microwave Radiometer (SMMR) in 1978 became an important milestone in the history of radiometry. It was the first time a conically scanning radiometer was used in space; it was brought in space on board of the NASA Nimbus satellite [4]. The launch of this mission gave a unique opportunity to image the Earth at a constant angle of incidence. In the beginning of 1980, new multi-frequency, dual-polarization radiometric instruments were developed. Two spacecraft carried with instruments of this type were launched simultaneously – Nimbus-7 and Seasat. The Nimbus-7 mission results brought new advances in the knowledge of the state of the World Ocean surface, state of snow and glacial cover. The successful usage of scanning multichannel microwave radiometers in space marked the beginning of the contemporary stage of microwave space radiometry [5]. Today, radiometers are widely used not only onboard different satellites but also as ground-based instruments integrated in worldwide observational networks.
Principle of operation
Solid matter (e.g. the earth's surface, ocean, sea ice, snow, vegetation) but also gases emit and absorb MW radiation. The atmospheric components emit and absorb MW radiation in different ways: Atmospheric gases provide specific absorption features (Fig. 1) which allow to derive information about their vertical profile. Examples for such absorption features are the oxygen absorption complex (magnetic dipole transitions) around 60 GHz which is used to derive temperature profiles or the water vapor absorption line around 22.235 GHz (dipole rotational transition) which is used to observe the vertical profile of humidity. Other significant absorption lines are found at 118.75 GHz (oxygen absorption) and at 183.31 GHz (water vapor, used for water vapor profiling under dry conditions). Weak absorption features due to ozone are used for stratospheric ozone density and temperature profiling [7].
In addition to gaseous absorption, scattering, absorption, and emission also originate from hydrometeors in the atmosphere.
 and vertical (red) polarization. Solid lines indicate a clear sky case, dotted lines the clear sky case with liquid cloud added. Some weather satellites have AMSU sensors on board and measure at the corresponding vertical lines.")
Microwave spectrum: The black lines show the spectrum from the view of a ground-based receiver, the colored lines the spectrum from a satellite over the ocean measuring at horizontal (blue) and vertical (red) polarization. Solid lines indicate a clear sky case, dotted lines the clear sky case with liquid cloud added. Some weather satellites have AMSU sensors on board and measure at the corresponding vertical lines.
Design
Basically, the radiometers have the general form of the design. Radiometer is consisted of few blocks: antenna system, microwave radiothermal receiver, recording and storage devices and radioengineering system for the transmission of obtained data to the processing step. Here is short description of several major blocks of radiometers:
- The antenna block receives radiation propagating in free space. This module transforms these electromagnetic waves into the oscillation modes guided in a transmission line.
- Radiometric receiving device consists of a high-frequency amplifier, a quadratic device and a low-frequency filter. The function of a high-frequency amplifier is to amplify the received signal in every frequency band.
- Recording and storage devices – these parts of the system are made for recording the measured parameters.
Also, depending on the particular characteristics of each instrument, the radiometer can be equipped with additional devices (for instance: rain, temperature and humidity sensors, GPS-receiver etc).
![Schematic presentation of the transmission of information from data to natural object (from Atmosphere to radio-frequency amplifier). Noise resistor and amplifier represent the emission reception parts [8].](/ag_crewell/lib/exe/detail.php?id=instruments%3Ahatpro%3Ahatpro&media=instruments:hatpro:mwr_4.png "Schematic presentation of the transmission of information from data to natural object (from Atmosphere to radio-frequency amplifier). Noise resistor and amplifier represent the emission reception parts [8].")
Retrieval of temperature and water vapor profiles
Temperature profiles can be obtained by measuring the radiation intensity, or brightness temperature, at points along the side of the oxygen feature at 60 GHz. By scanning downward from line center onto the wing of the line, the instrument can obtain altitude information. Emission at any altitude is proportional to local temperature and density of oxygen; therefore the temperature profile can be retrieved. Water vapor profiles can be obtained by observing the intensity and shape of emission from pressure broadened water vapor lines. The water vapor line at 22 GHz is a narrow line at high altitudes and is pressure broadened at low altitudes. The intensity of emission is proportional to vapor density and temperature. Scanning the spectral profile and mathematically inverting the observed data provides water vapor profiles.
The process of inverting the measured brightness temperature, TB_meas, in order to retrieve the profiles of atmospheric parameters (temperature, water vapor density, and cloud liquid density), generally requires an initial-guess for these profiles. The guess profiles are then corrected based on the difference of TB_meas and TB_guess, (obtained via forward-model and the guess profiles), i.e., ΔTB=TB_meas- TB_guess. The process can be repeated until ΔTB is minimized. When inverting for a particular quantity, e.g., temperature profile, the measurement frequency, or the so-called spectral channel, is chosen in such a way that the sensitivity of the measurements is maximized with respect to the perturbations in that parameter. However, there is always some influence on the measurements from other parameters, i.e., effect of water vapor and clouds on the temperature sounding, etc. As a result, for accurate retrieval, it is best to make simultaneous use of temperature, water vapor, and the cloud liquid channels, thereby, taking into account the influence of all these profiles together, on the measured brightness temperature.
Along with measurements at several frequency channels, angular scans of the atmosphere provide additional information especially for the boundary layer studies.
 |  |
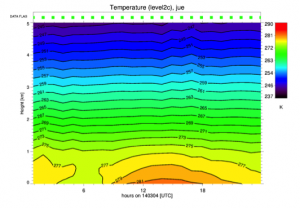 | 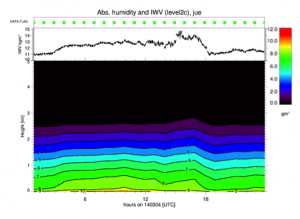 |
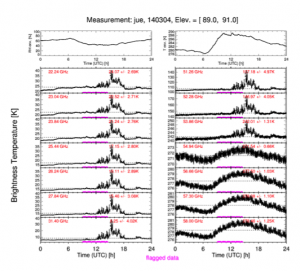
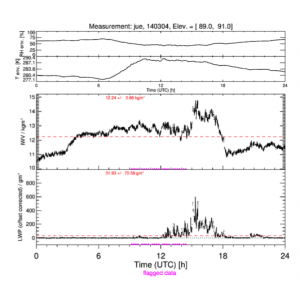
Time series on the 14th of April 2015 for (a) the brightness temperatures measured in 7 different frequencies on the MWR in the K (right) and V (left) bands, (b) Integrated Water Vapor and Liquid Water Path, © Temperature profiles from 0 to 5 km, (d) Absolute humidity profiles from 0 to 5 km.
MWRnet
MWRnet is a network established in 2009 connecting people working with ground-based microwave radiometers. MWRnet aims to facilitate the exchange of information in the MWR user community fostering the participation to coordinated international projects. In the long run, MWRnet’s mission aims at setting up operational software, quality control procedures, data formats, etc. similar to other successful networks such as EARLINET, AERONET, CWINDE.
![Distribution of ground based microwave radiometers across the globe by type [3]](/ag_crewell/lib/exe/detail.php?id=instruments%3Ahatpro%3Ahatpro&media=instruments:hatpro:mwr_3.png "Distribution of ground based microwave radiometers across the globe by type [3]")
Distribution of ground based microwave radiometers across the globe by type [3]
References
- Thermal Microwave Radiation: Applications for Remote Sensing, C. Matzler, 2006, The Institution of Engineering and Technology, London, Chapter 1.
- Eugene A. Sharkov, “Passive Microwave Remote Sensing of the Earth”, Physical Foundations, Springer-Praxis Books in Geophysical Sciences, Chapter 14: Passive microwave space missions
- Cimini et al., 2009
- Klein and Gasiewski, 2000
- Eugene A. Sharkov, “Passive Microwave Remote Sensing of the Earth”, Physical Foundations, Springer-Praxis Books in Geophysical Sciences, Chapter 3: Microwave radiometers: functions, design, concepts, characteristics [http://www.iki.rssi.ru/asp/pub_sha1/pub_sha1.htm]