Current ceilometer data
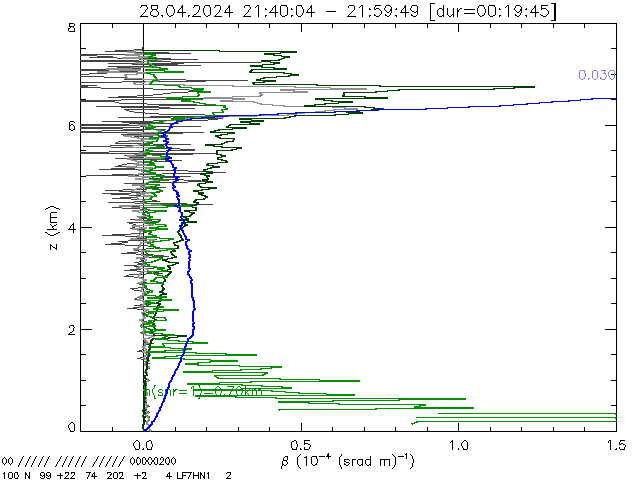
Backscatter profiles as measured by our Vaisala Ceilometer
installed at the FZ-Jülich.
Darkgray: the most current profile of the backscatter coefficient (β),
lightgray, dark green and green: the temporal average, standard deviation and
signal to noise ratio of β for the last 20 minutes, blue: the bottom up integral
and red: detected cloud heights.
data(vaisala) data(ascii)
See also Total Sky Imager, Microwave radiometer, Sodar, MRR,
radio soundings Essen, Volcanic ash cloud April 16, 2010.
last 2 hours:
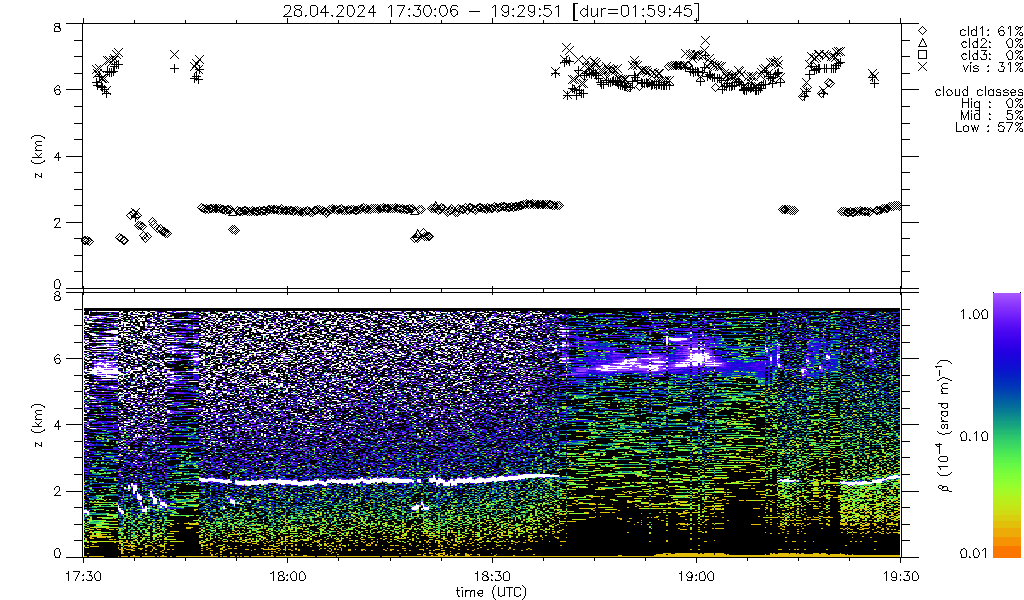
Cloud heights (top) and β (bottom) of the last 2 hours. Different symbols
(diamond, triangle, square) represent the detected cloud heights or vertical visibiliy
and height of maximum backscatter (+ and x) respectively.
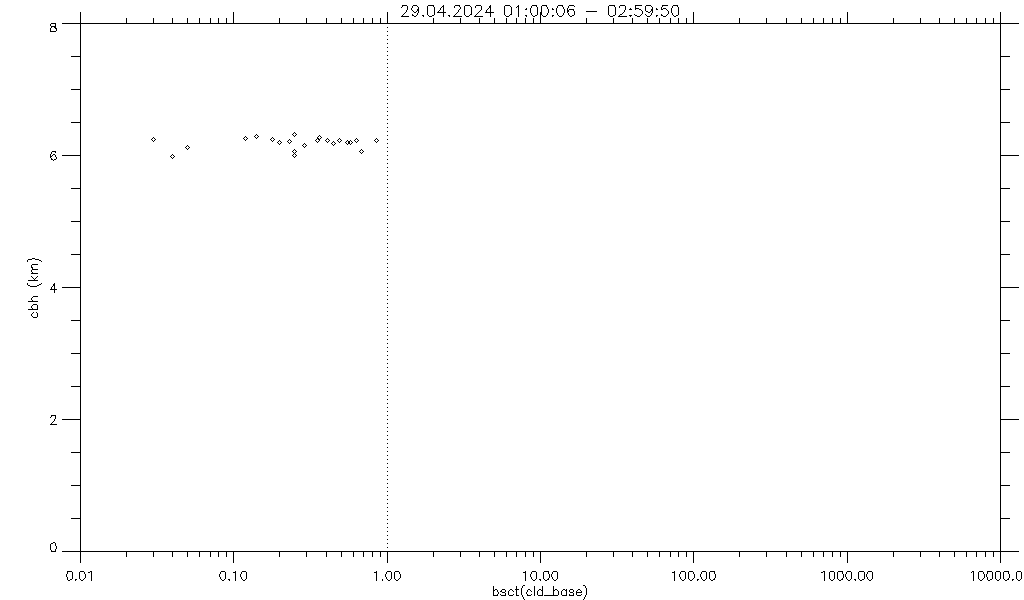
Backscatter at first cloudbase height.
Cloud cover:
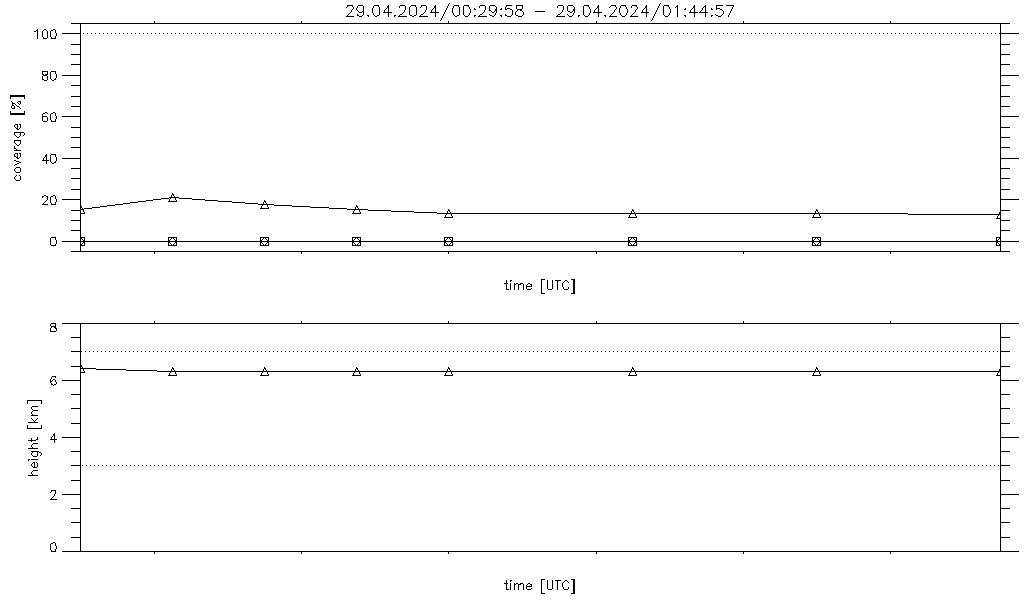
Top: Average cloud cover per 2h interval for low, mid and high level clouds (diamond, triangle, square)
Bottom: height of repsective cloud class. Cloud classes are separated at 3 and 7km height respectively.
β in the surface layer
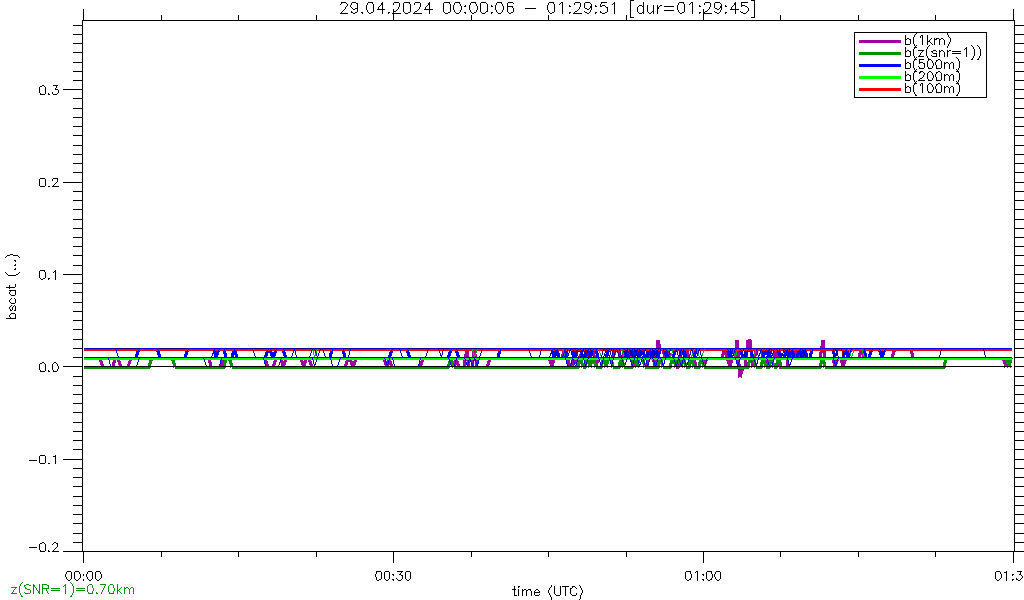
β vs time for the layers below 100m (red), 200m (light green) and 500m (blue), at
1000m (magenta) and at the level where the last profile reached SNR=1 (green). Values
for levels at exactly 100m, 200m and 500m are drawn as thick color satured lines, values from
levels below have darker colors and thin lines.
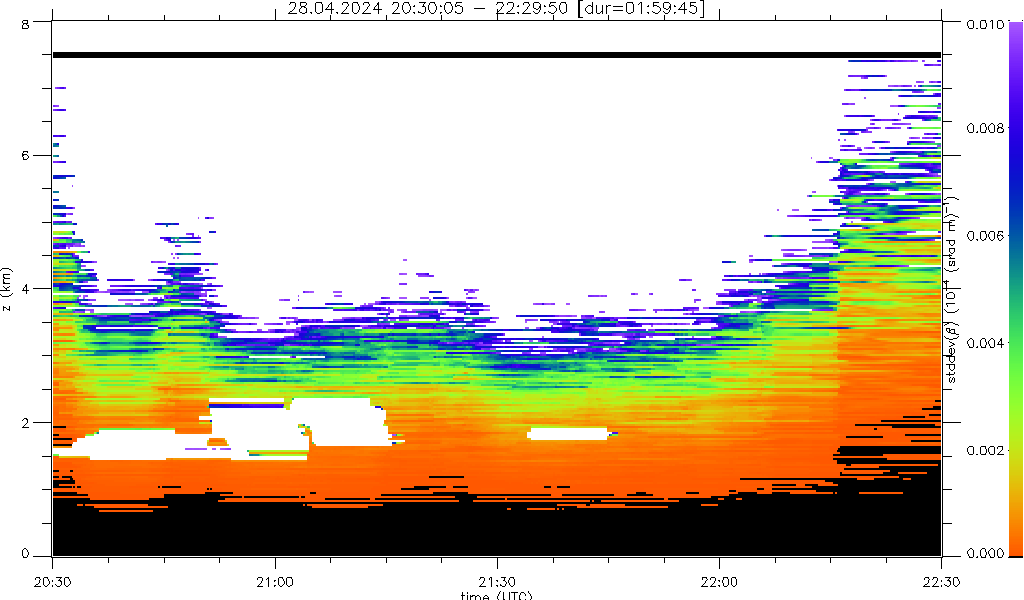
Standard deviation of backscatter at a certain level over 5 minutes.
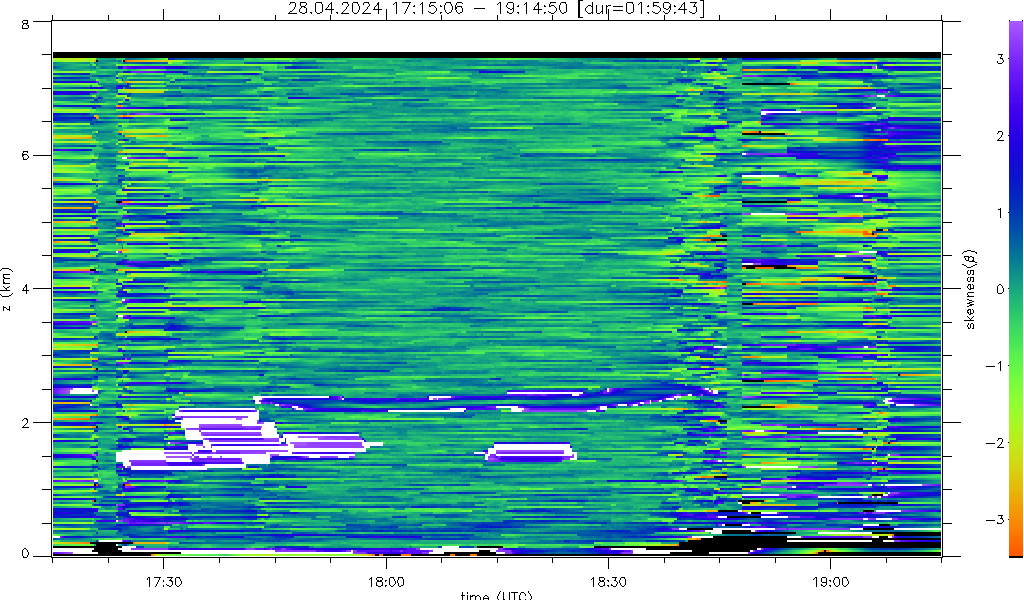
Skewness of backscatter at a certain level over 5 minutes.
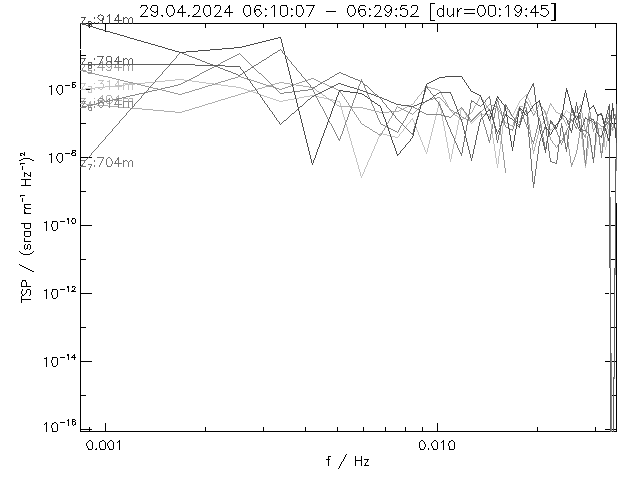
Temporal spectral power (TSP) of backscatter coeficient at different levels during the last 20 minutes.
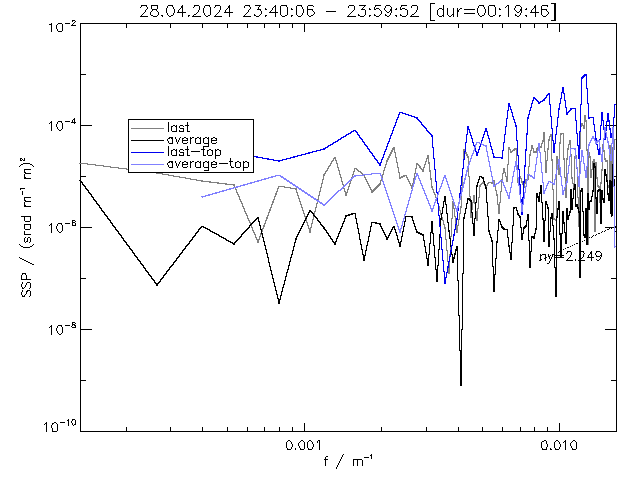
Spatial spectral power (SSP) of the very last profile and the 20 minutes average profiles.
Marked with 'top' are SSP's from the upper third of the profiles where the signal is dominated by instrumental noise.
yesterday
(c) Jan Schween 2009