ASD samples for our MWR
Allan standard deviation samples for our microwave radiometers.
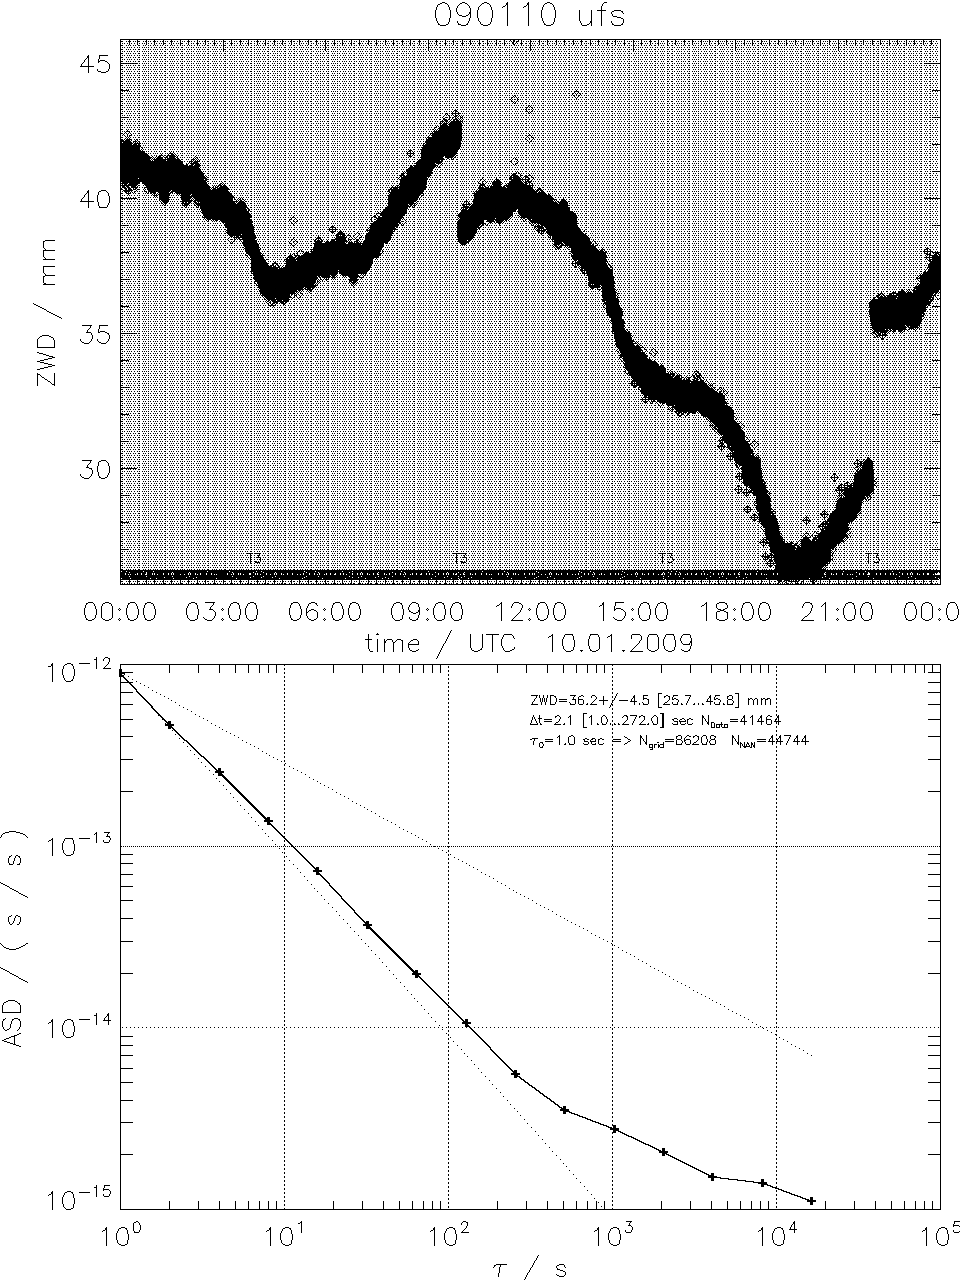
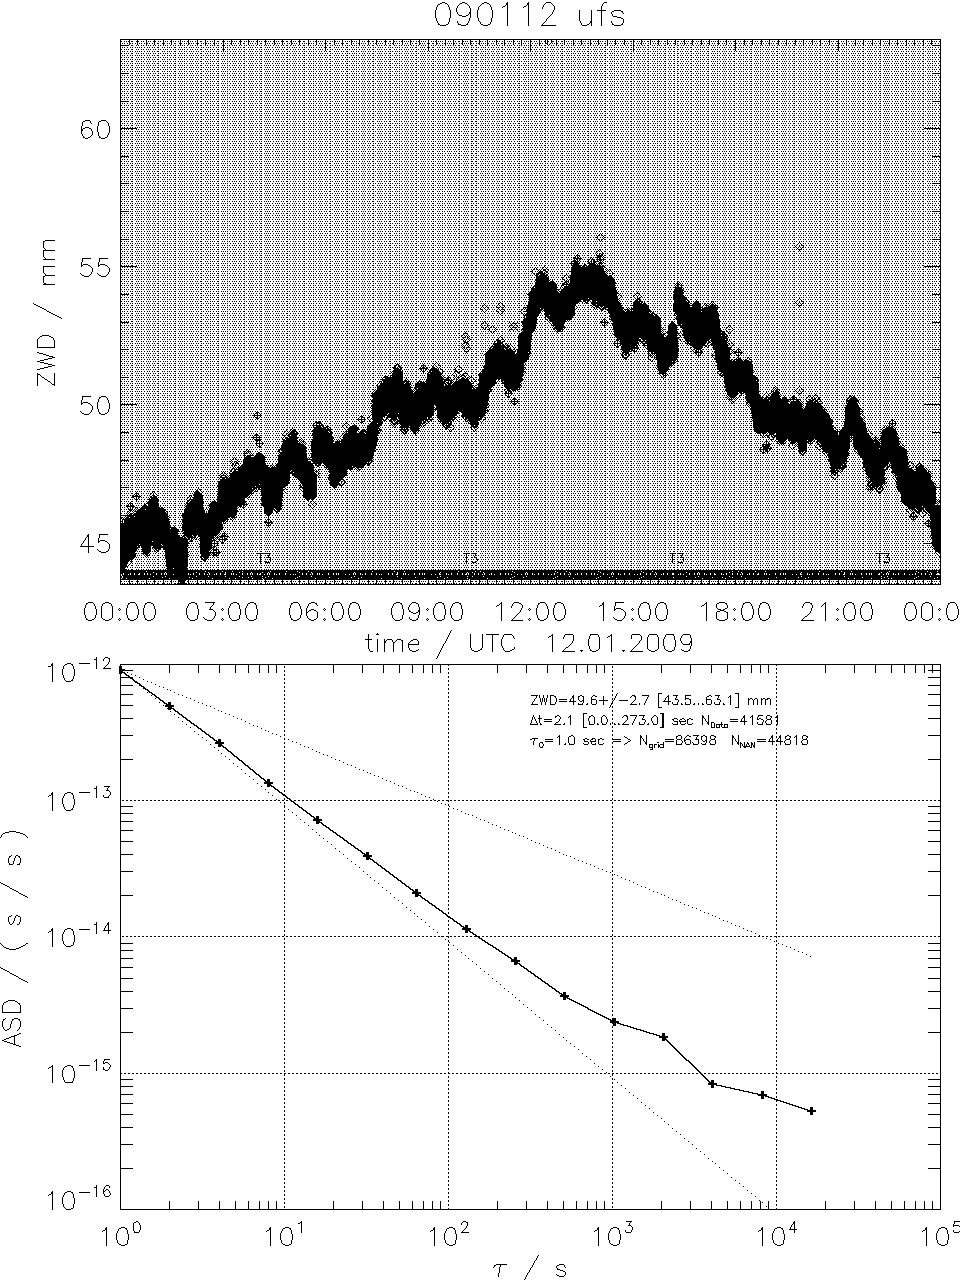
UFS
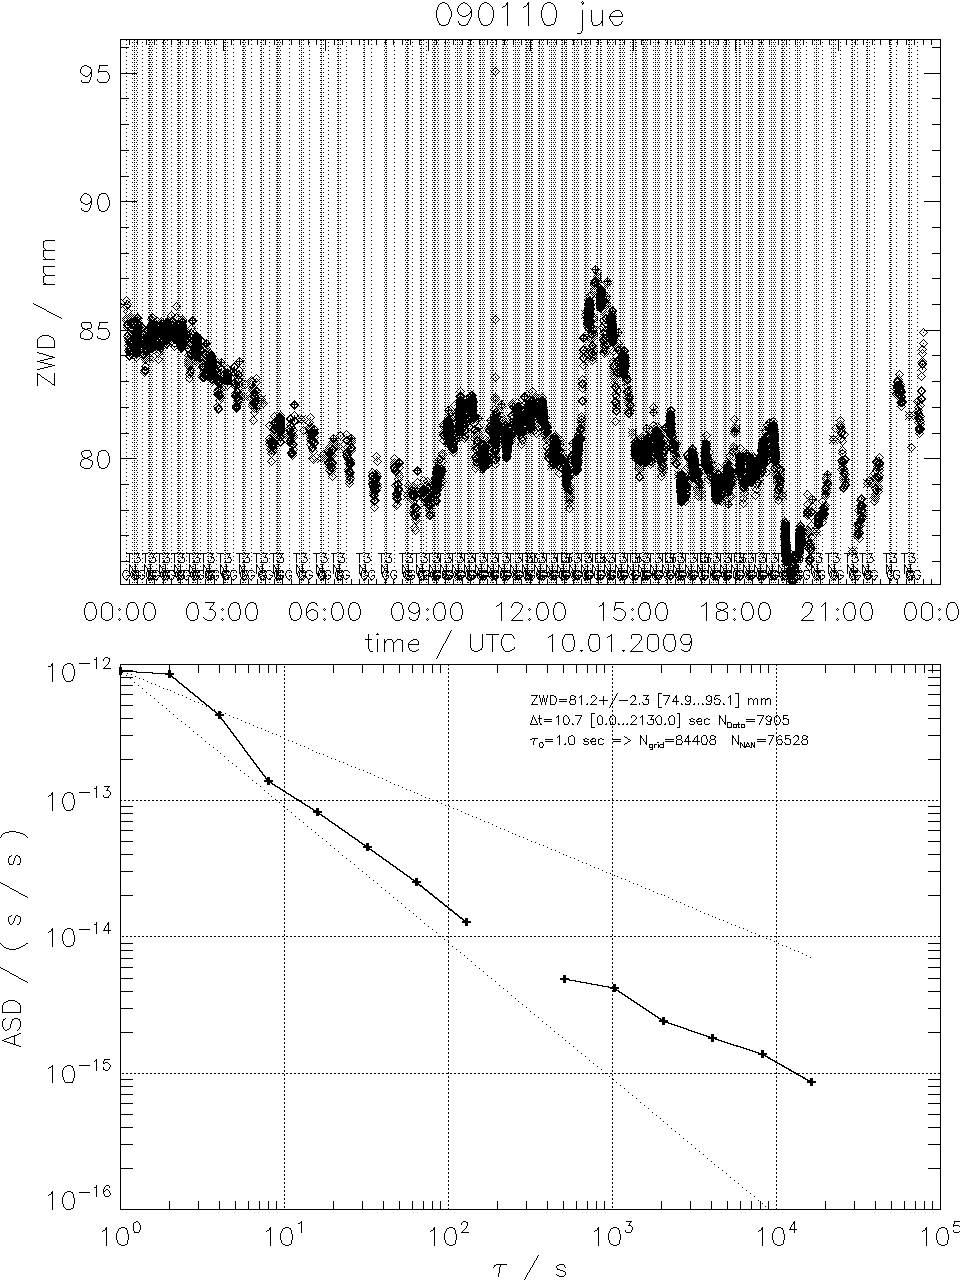
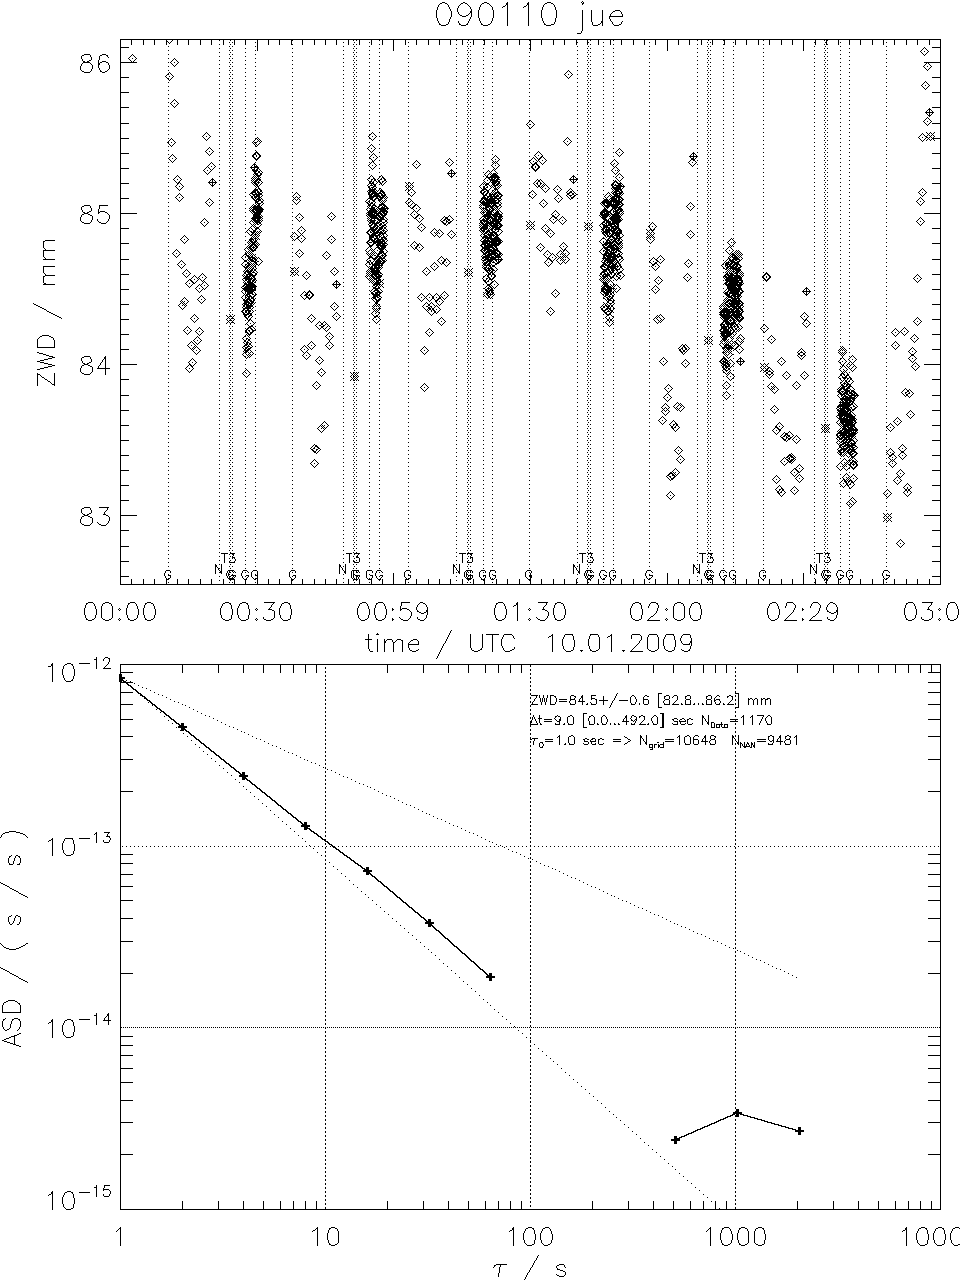
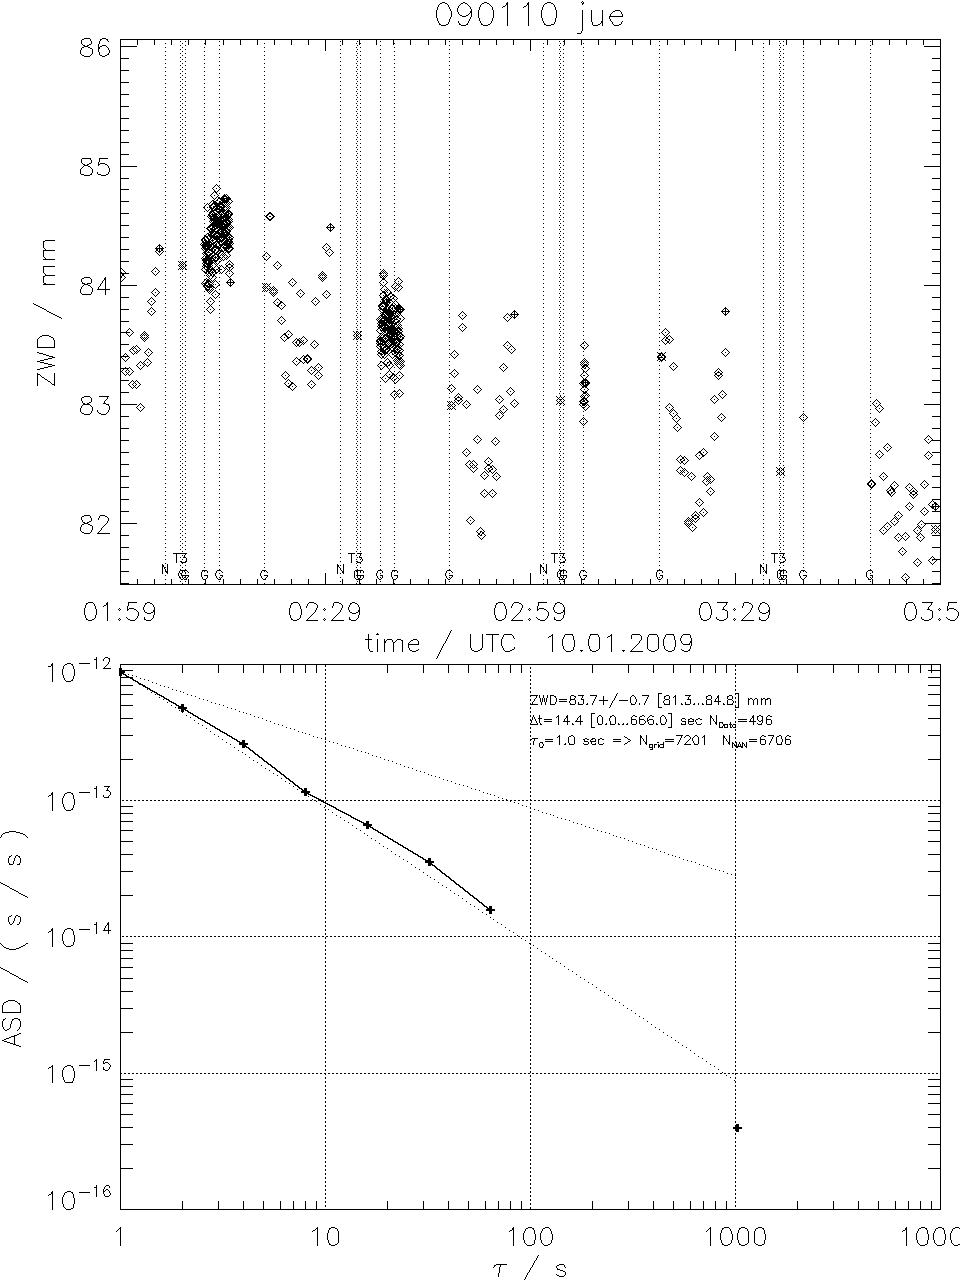
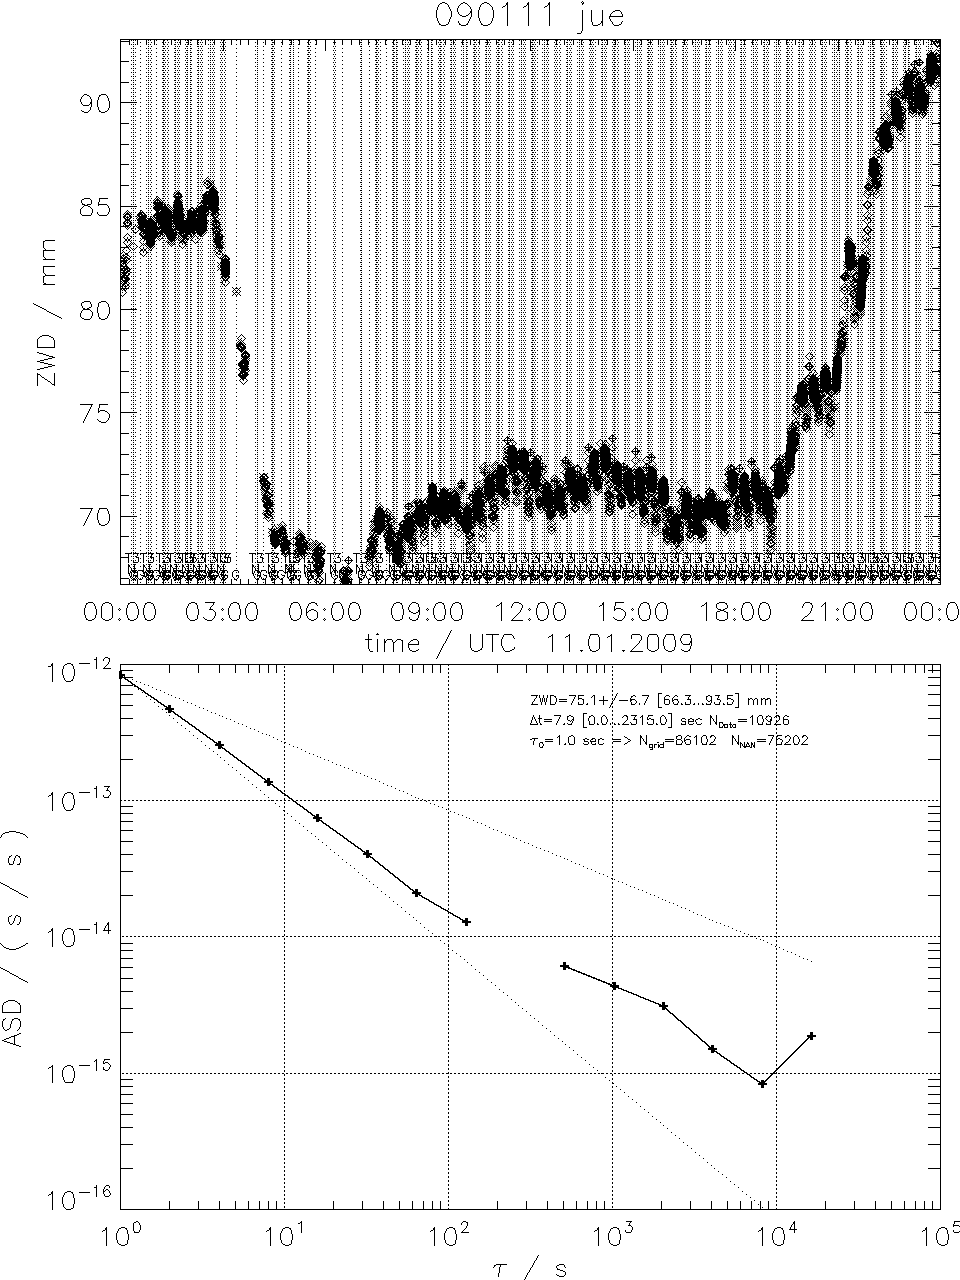
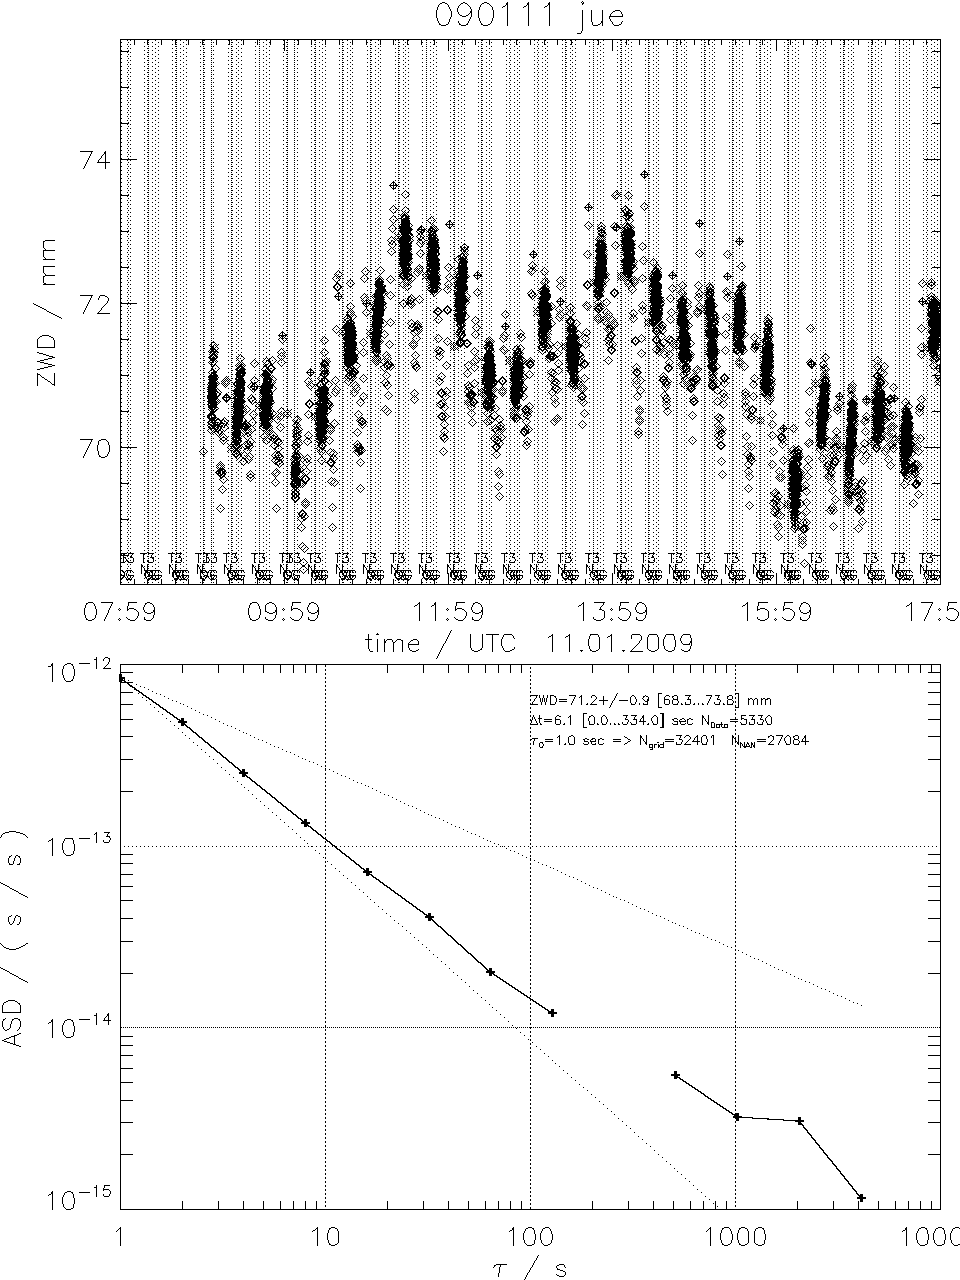
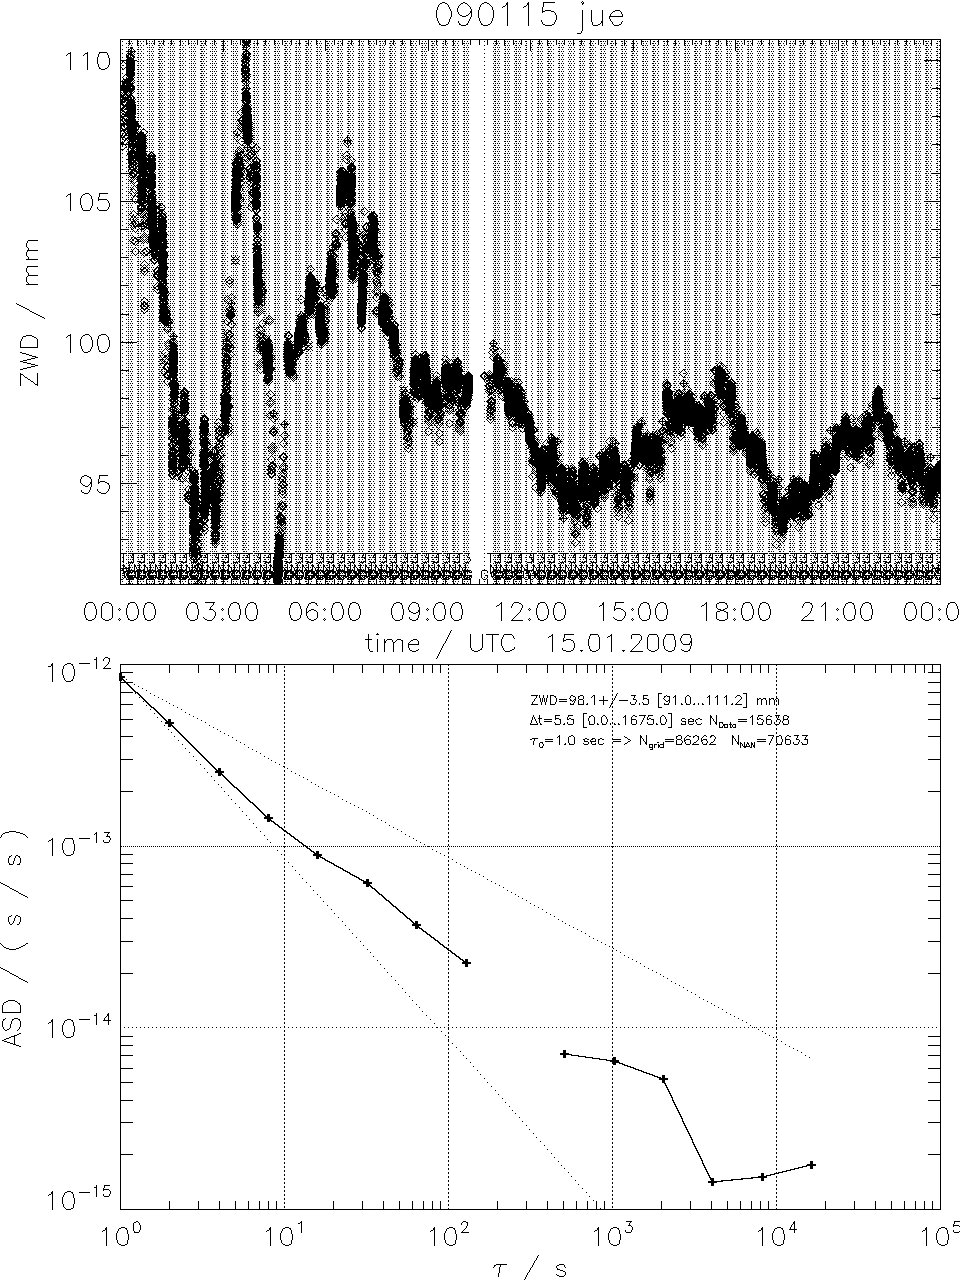
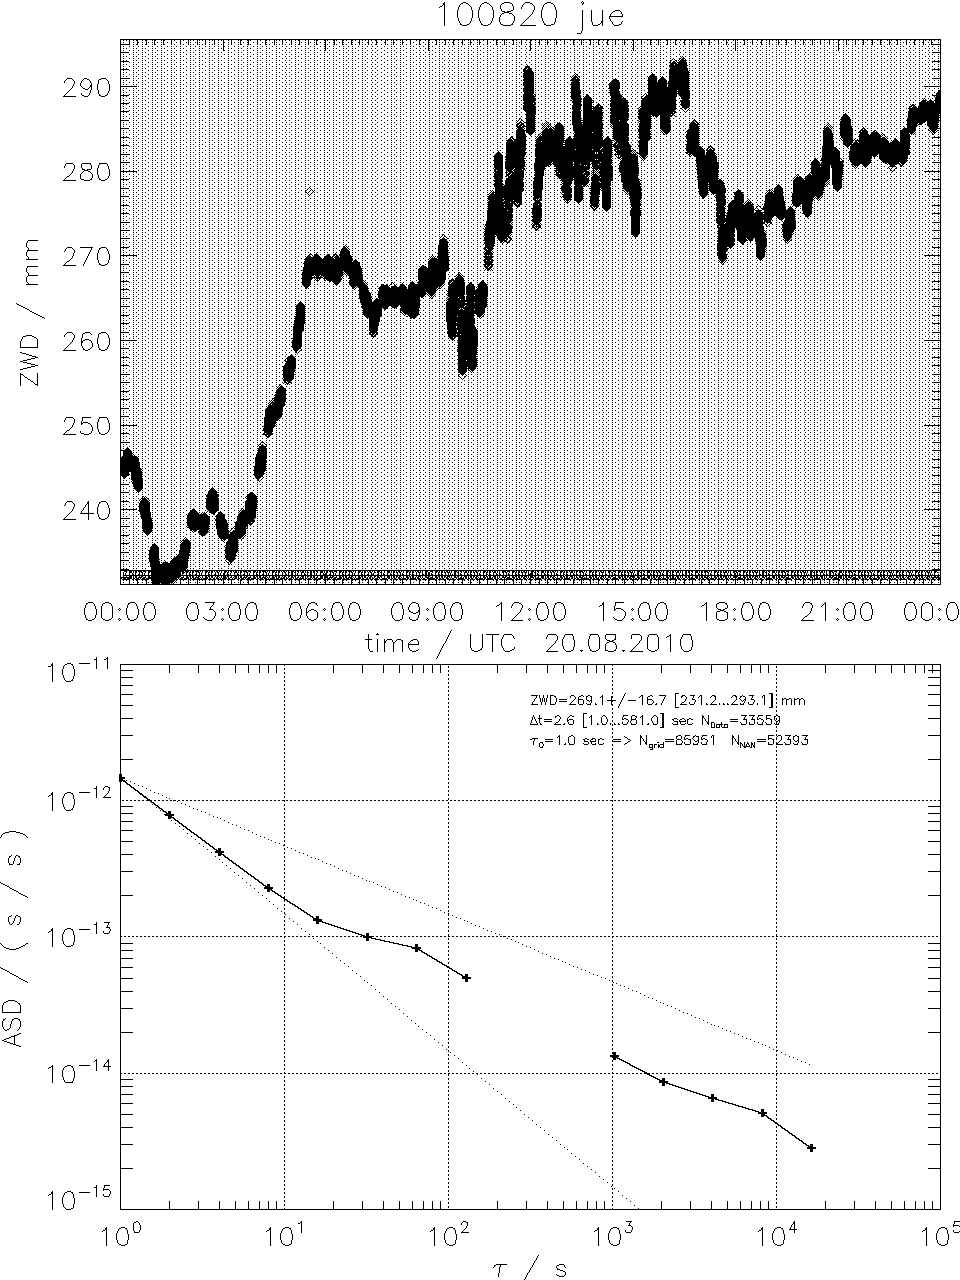
JUE SUNHAT
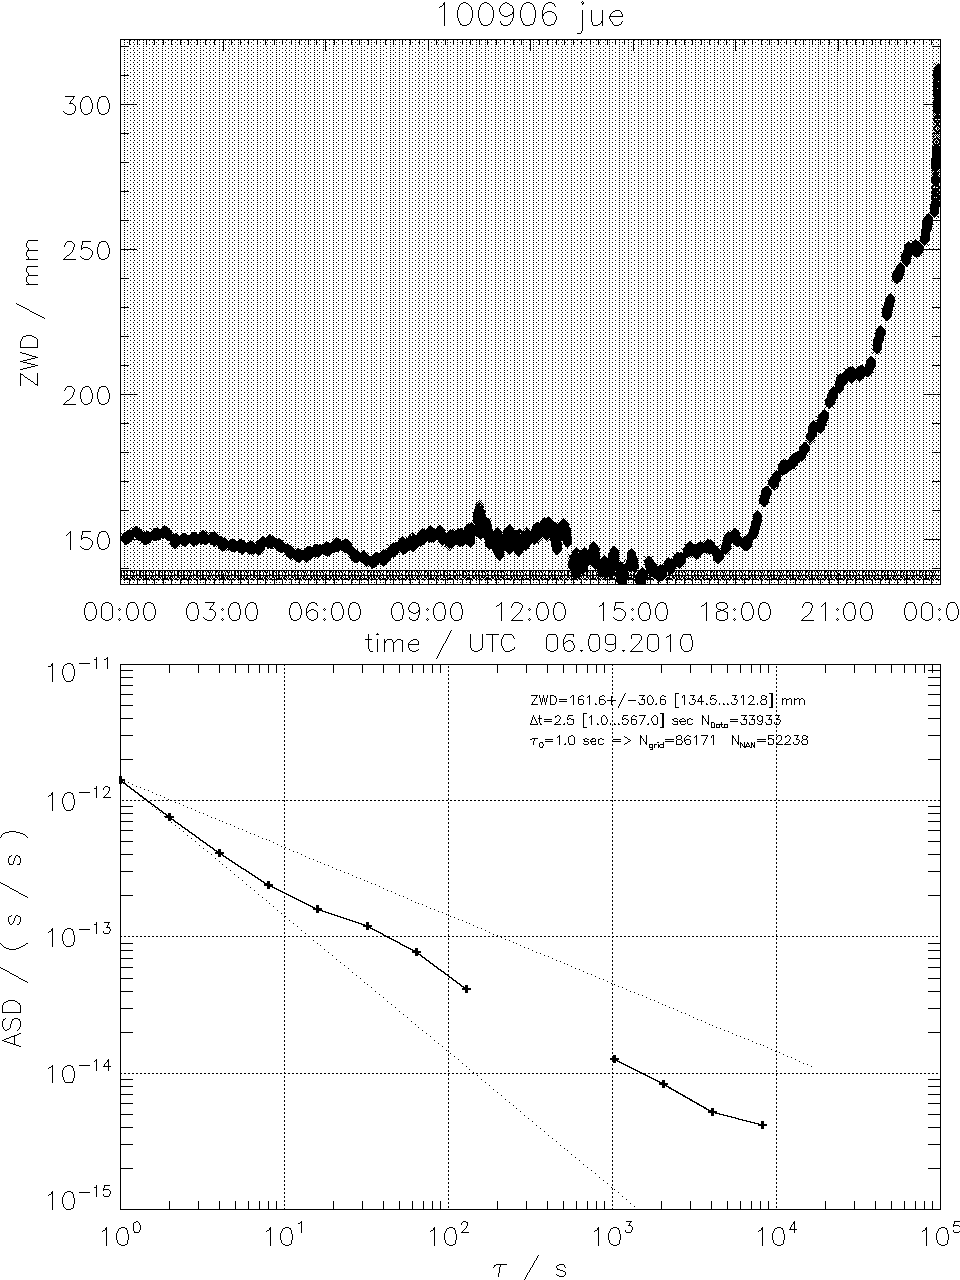
JUE TOPHAT
RHU
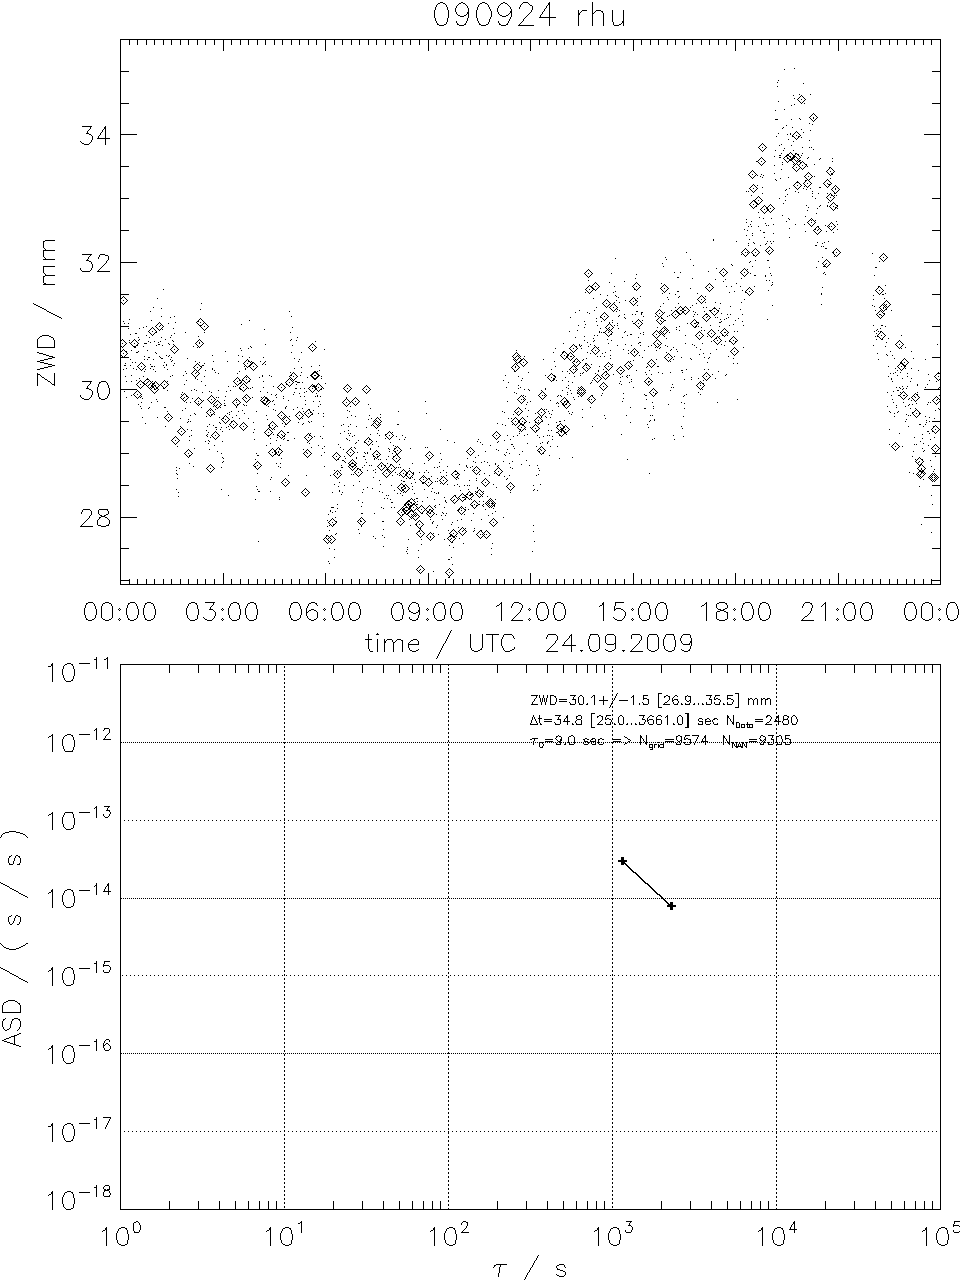
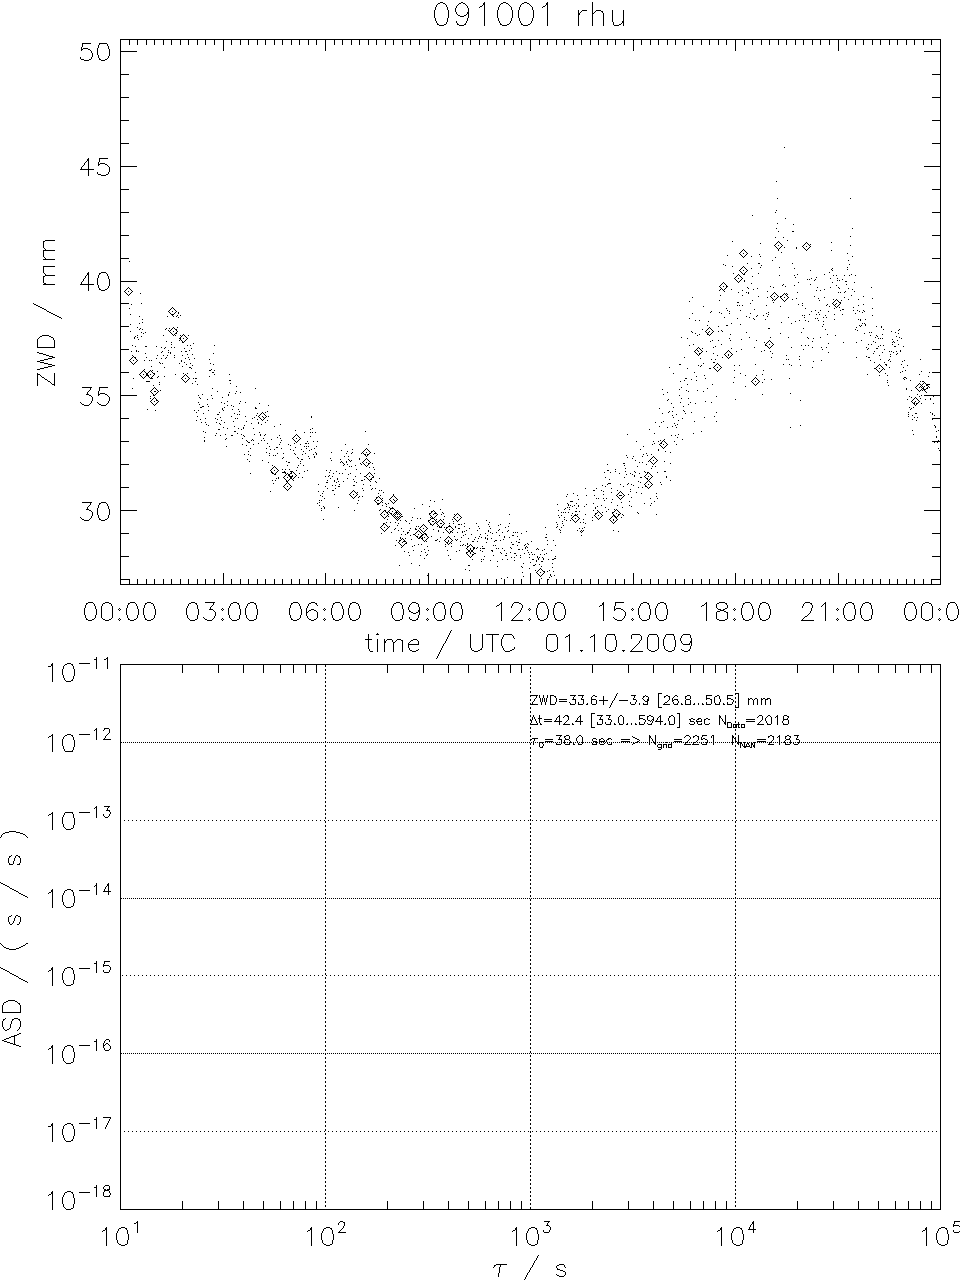
For the RHU data it is not possible to generate a evenly spaced datarow
as the instrument was scanning continously and only few vertical measurements
on a regular grid are available.
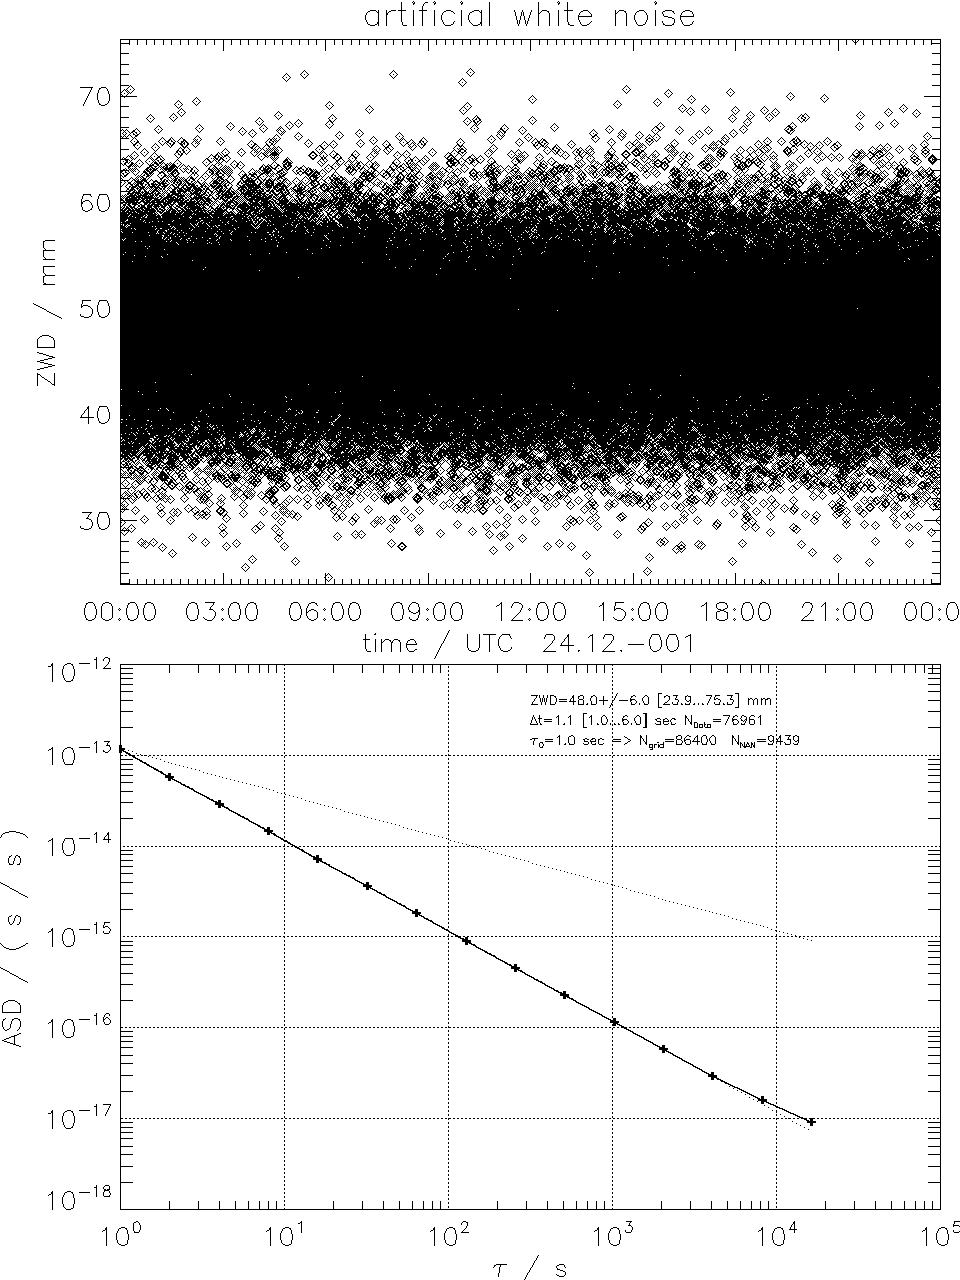
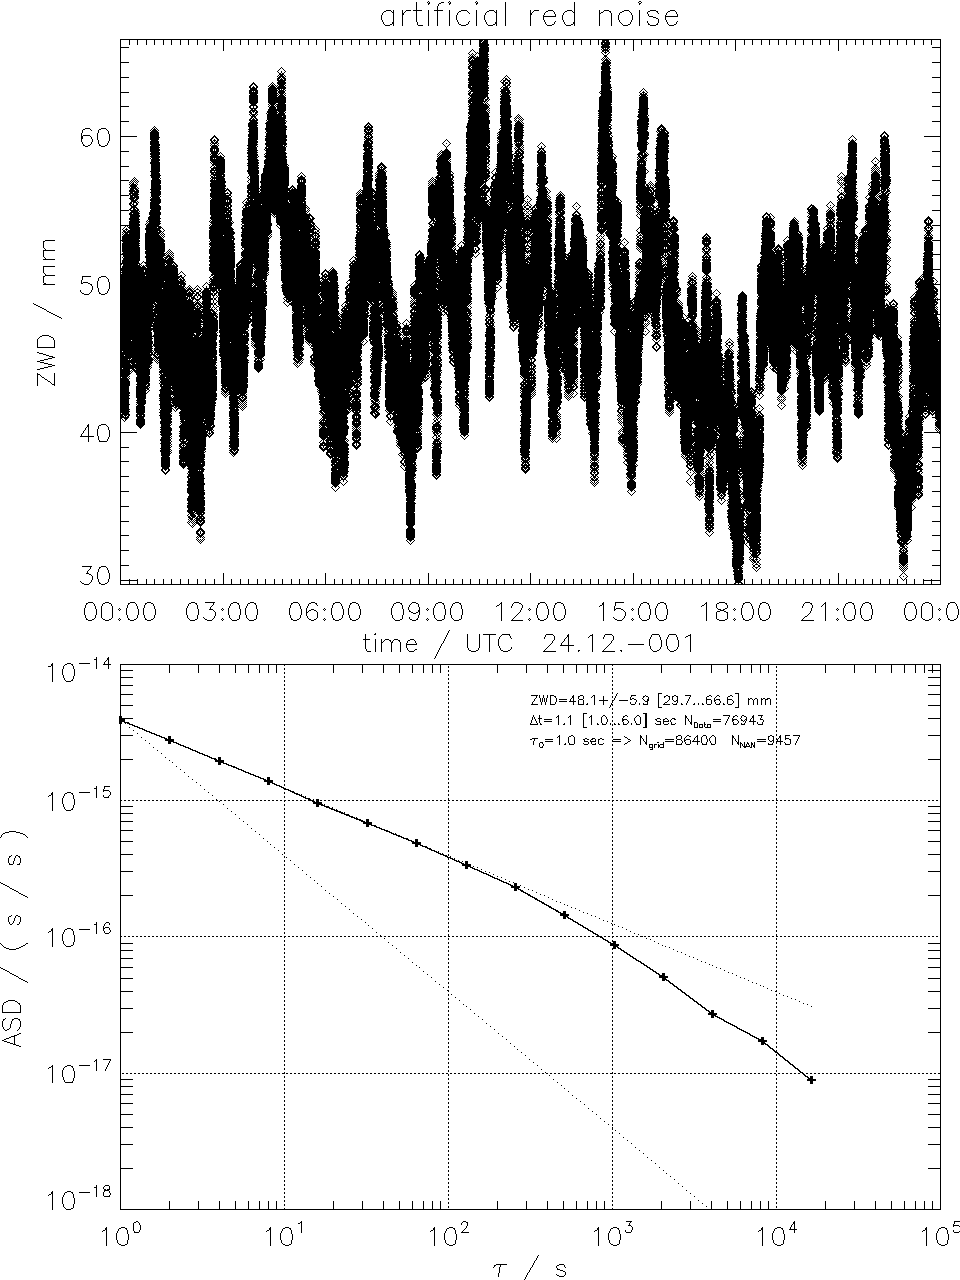
artificial noise
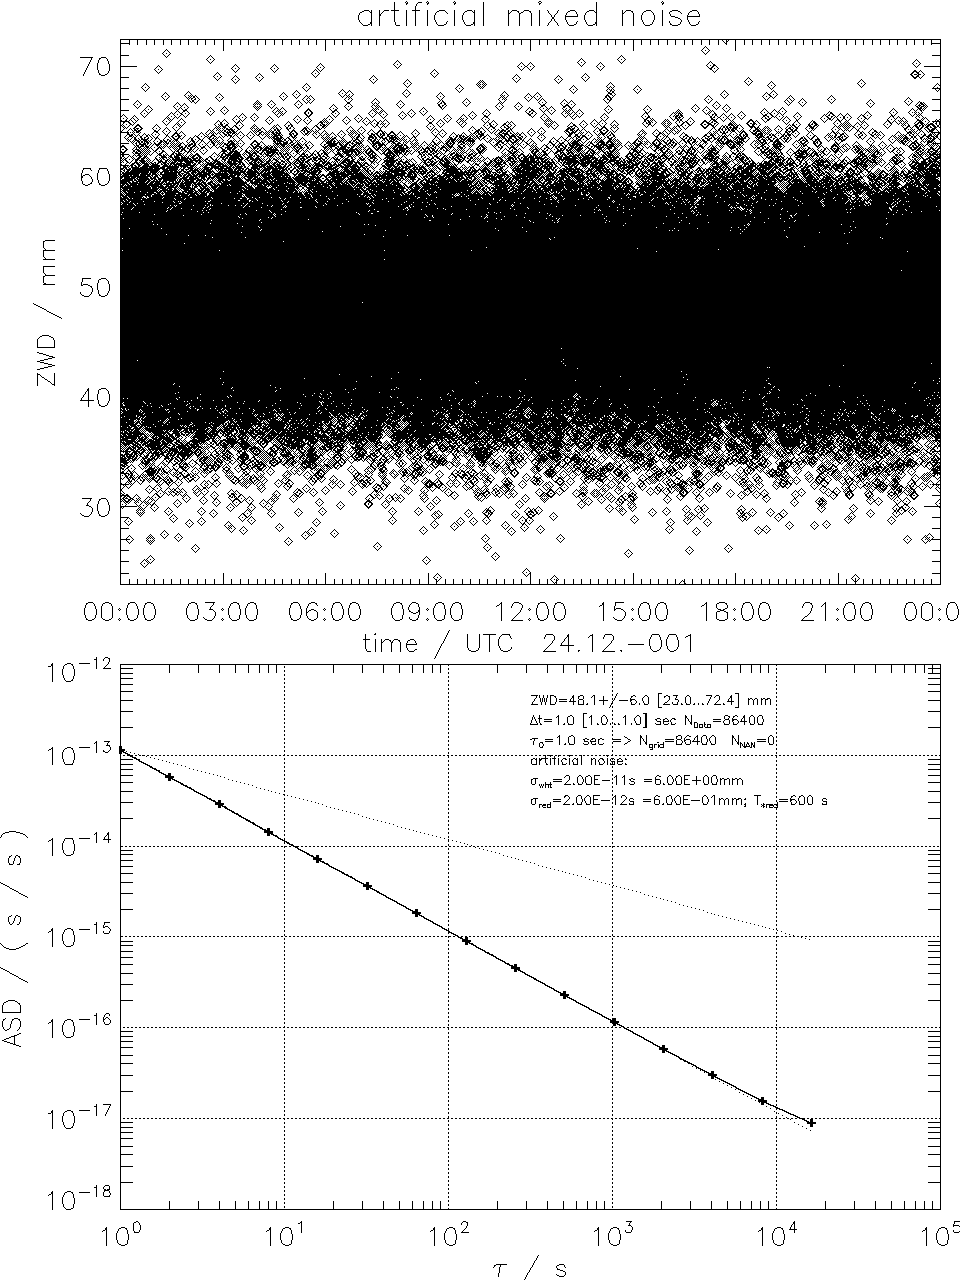
description
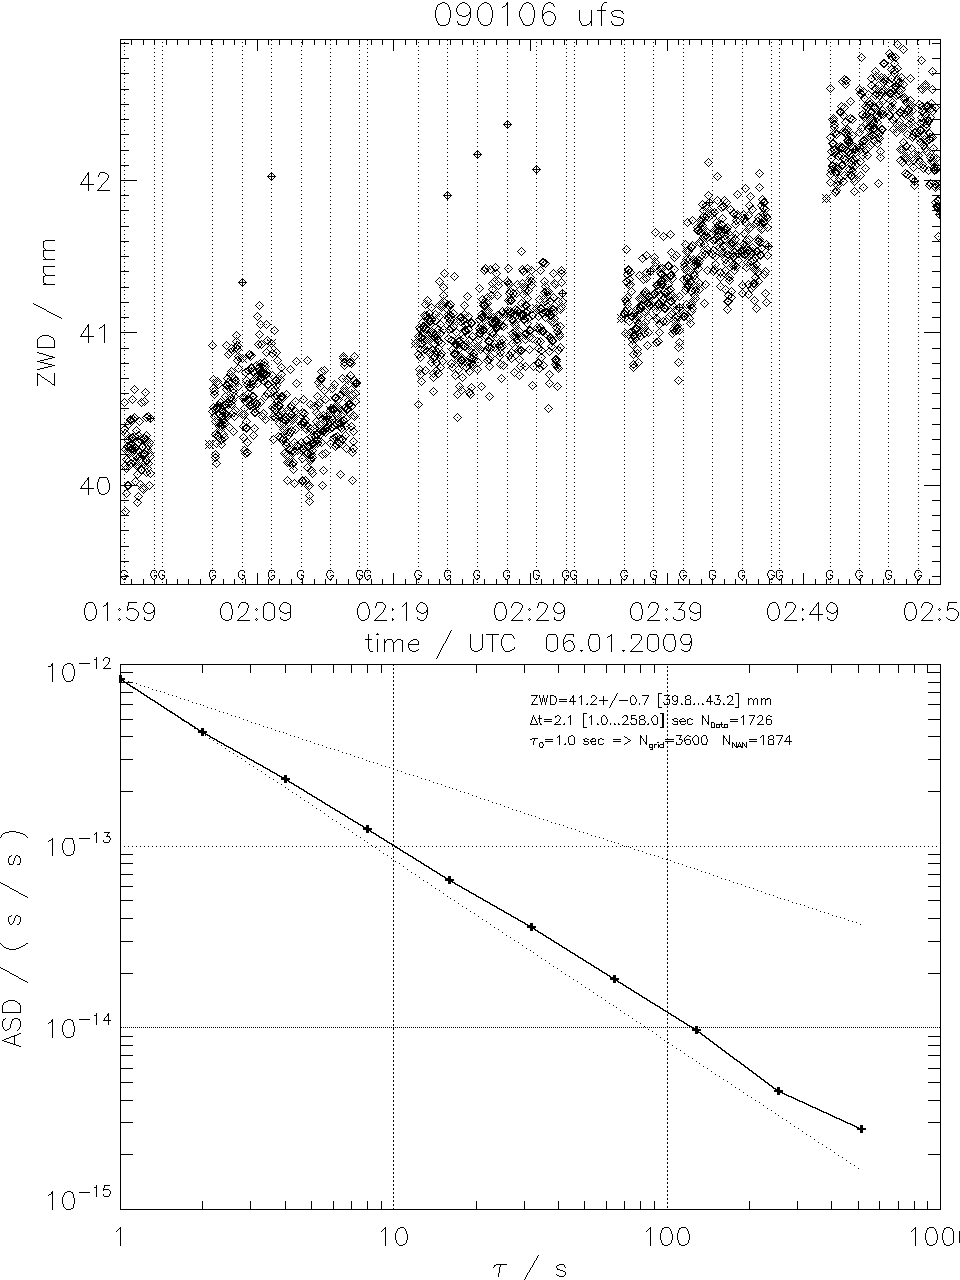
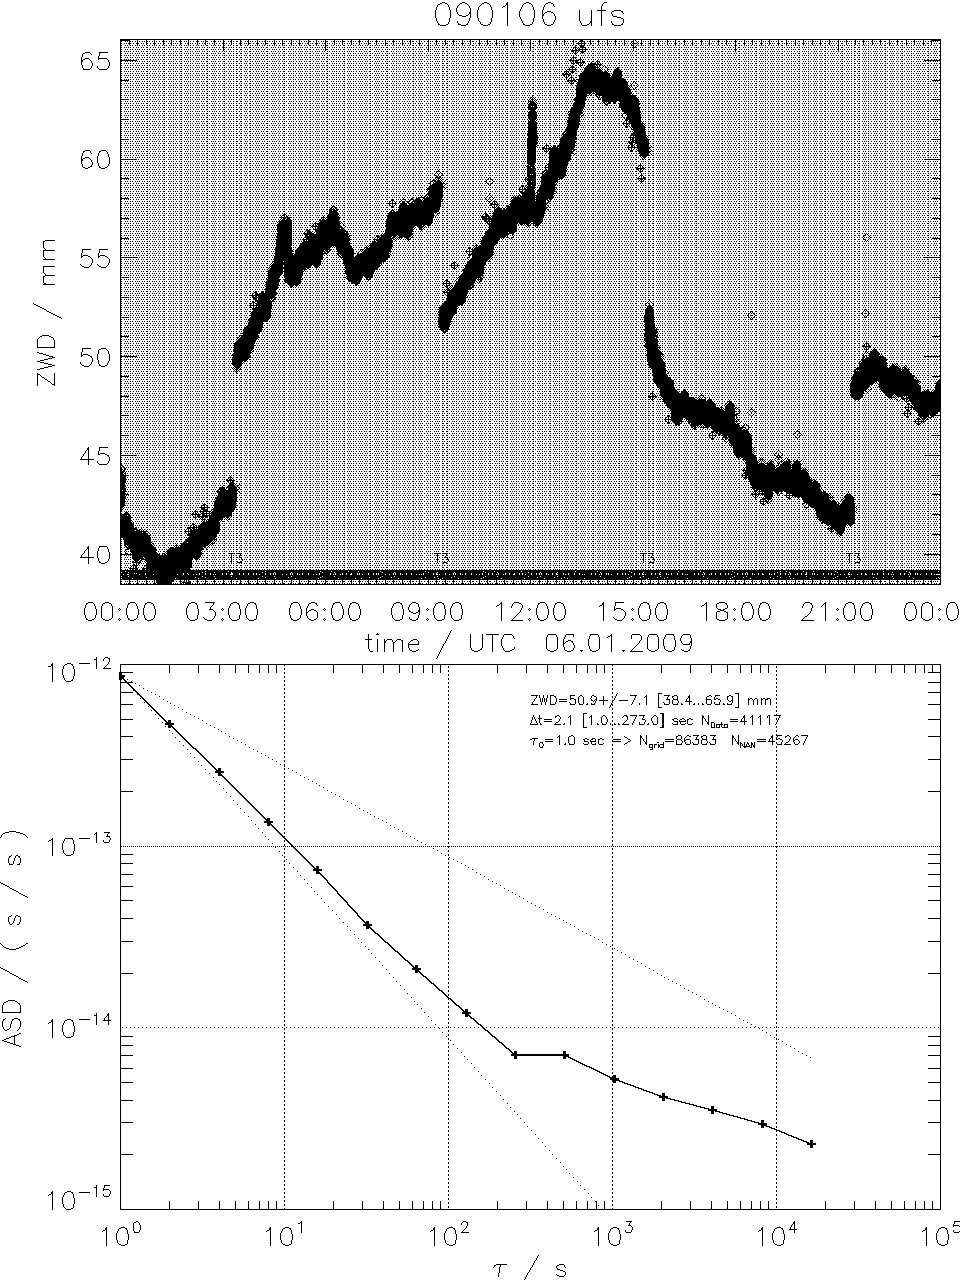
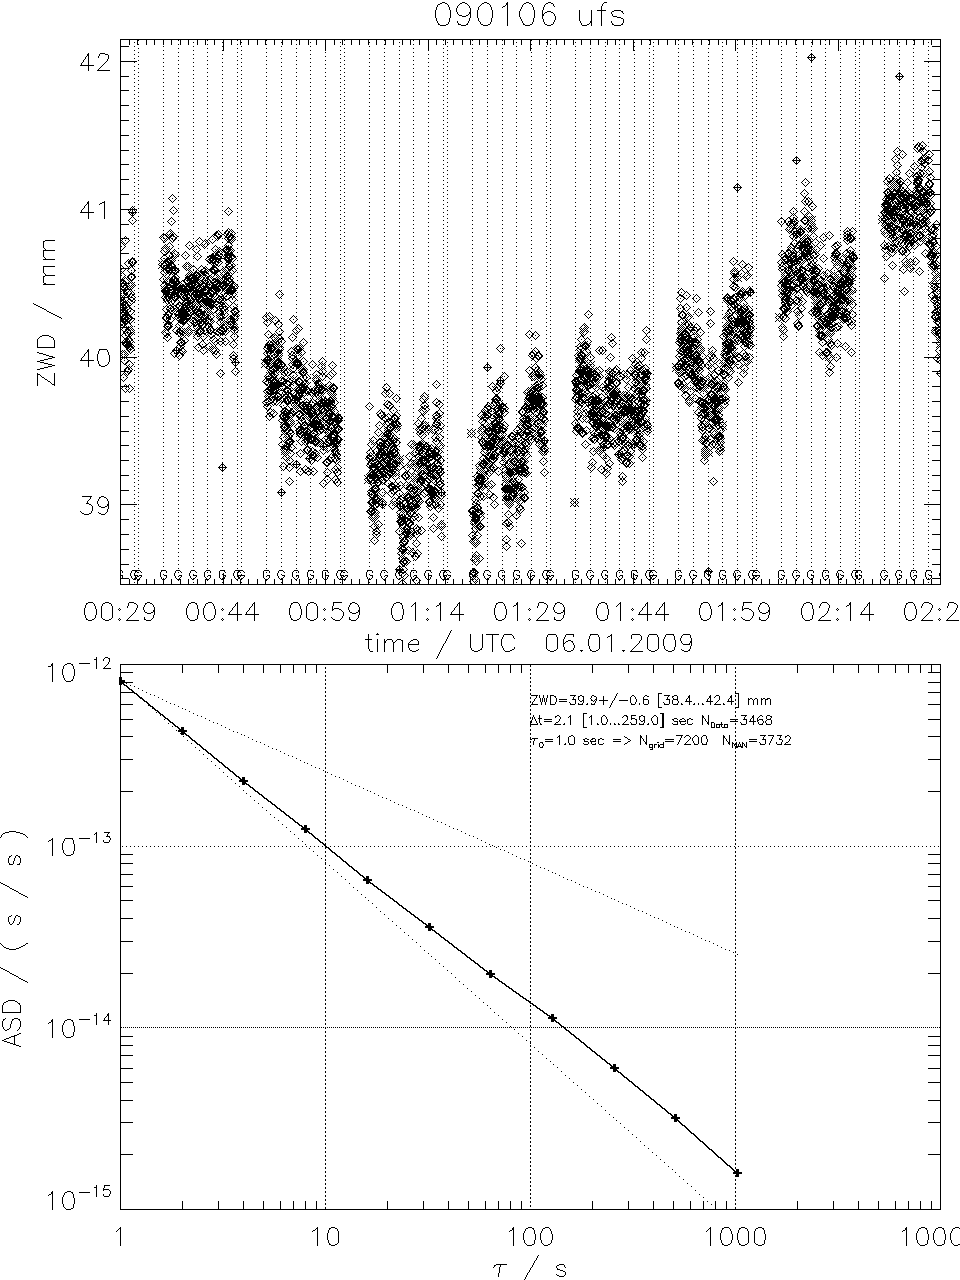
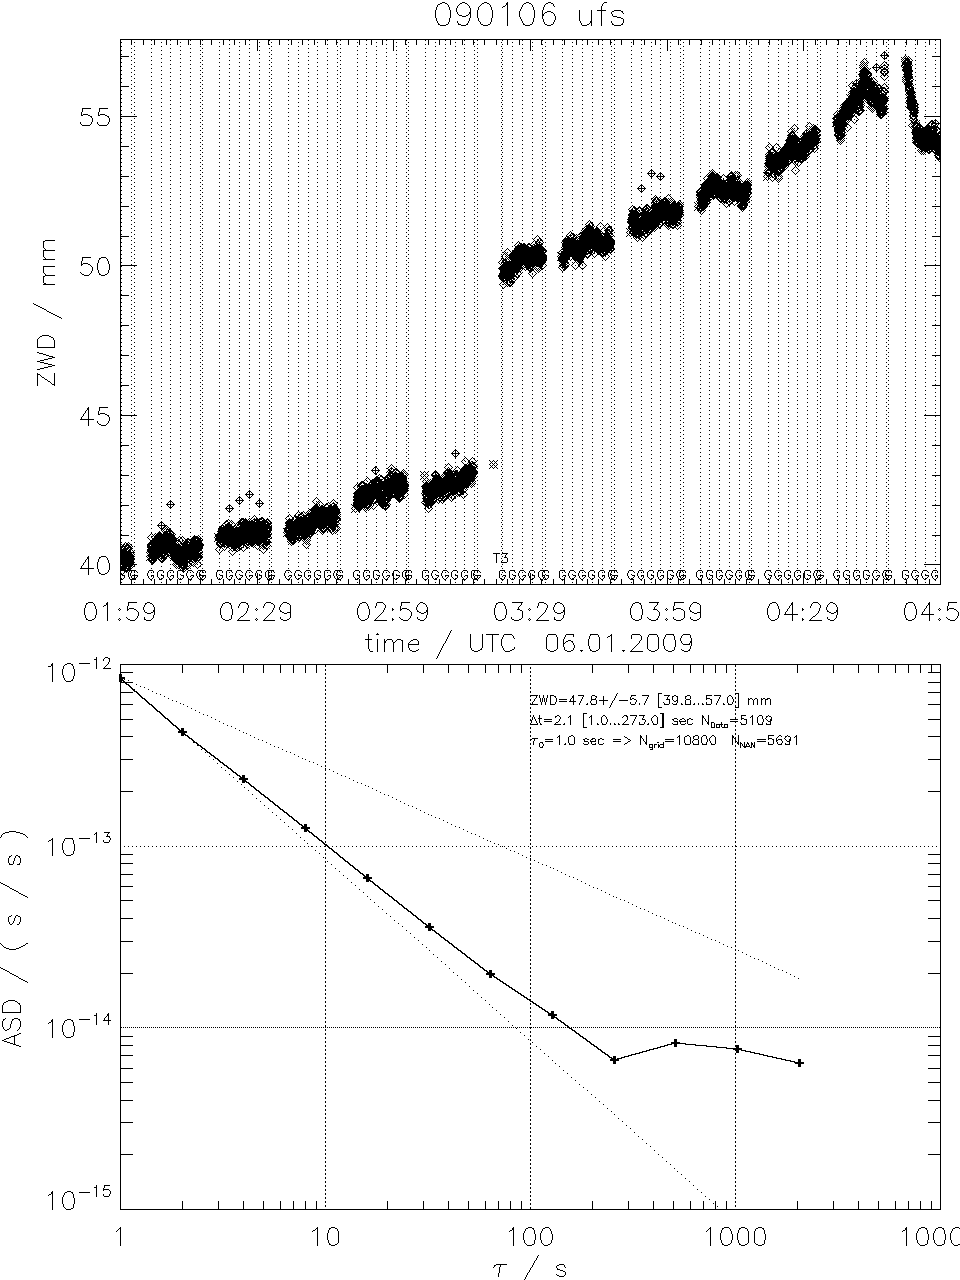
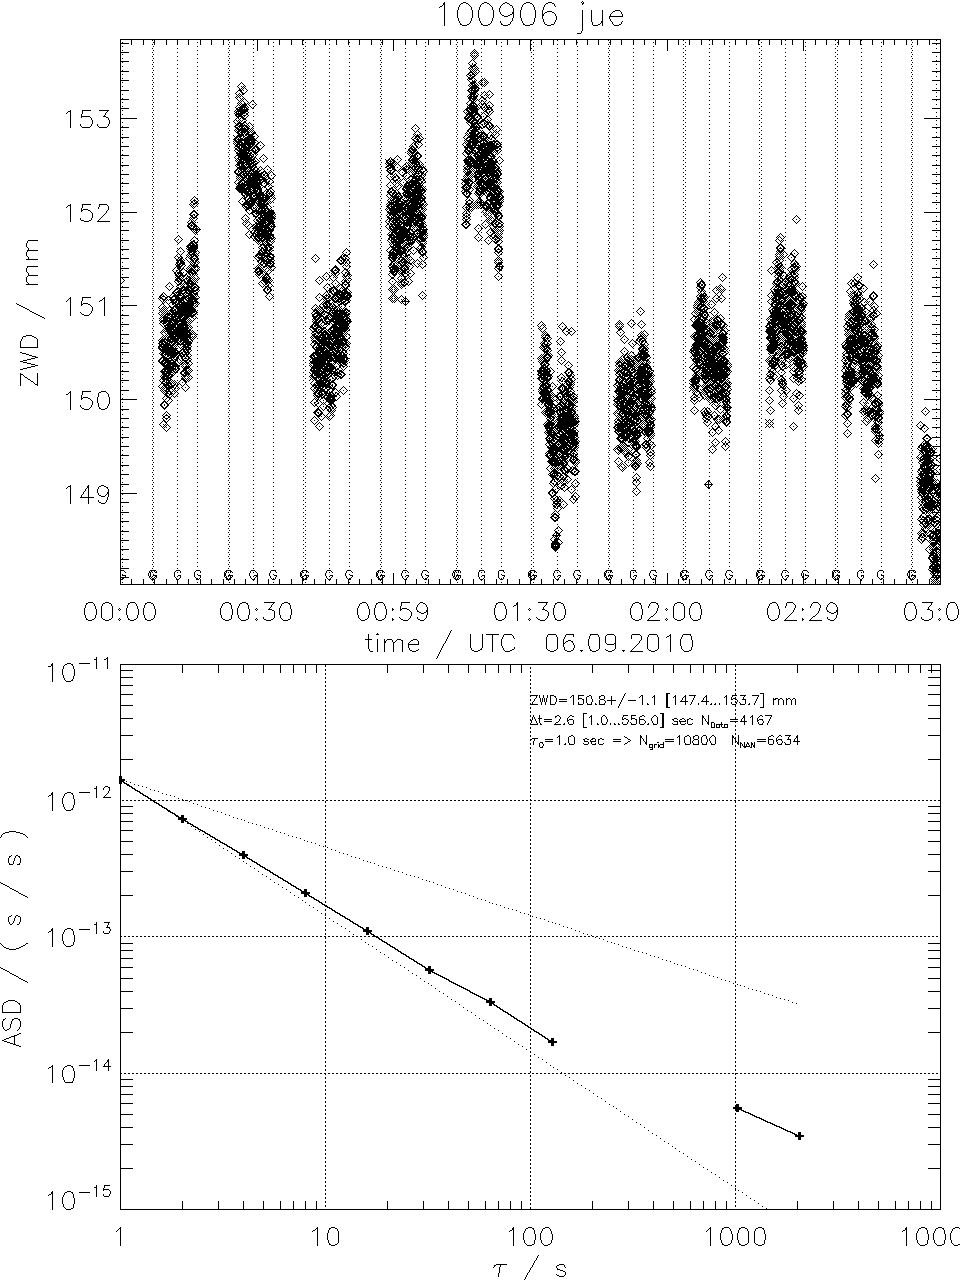
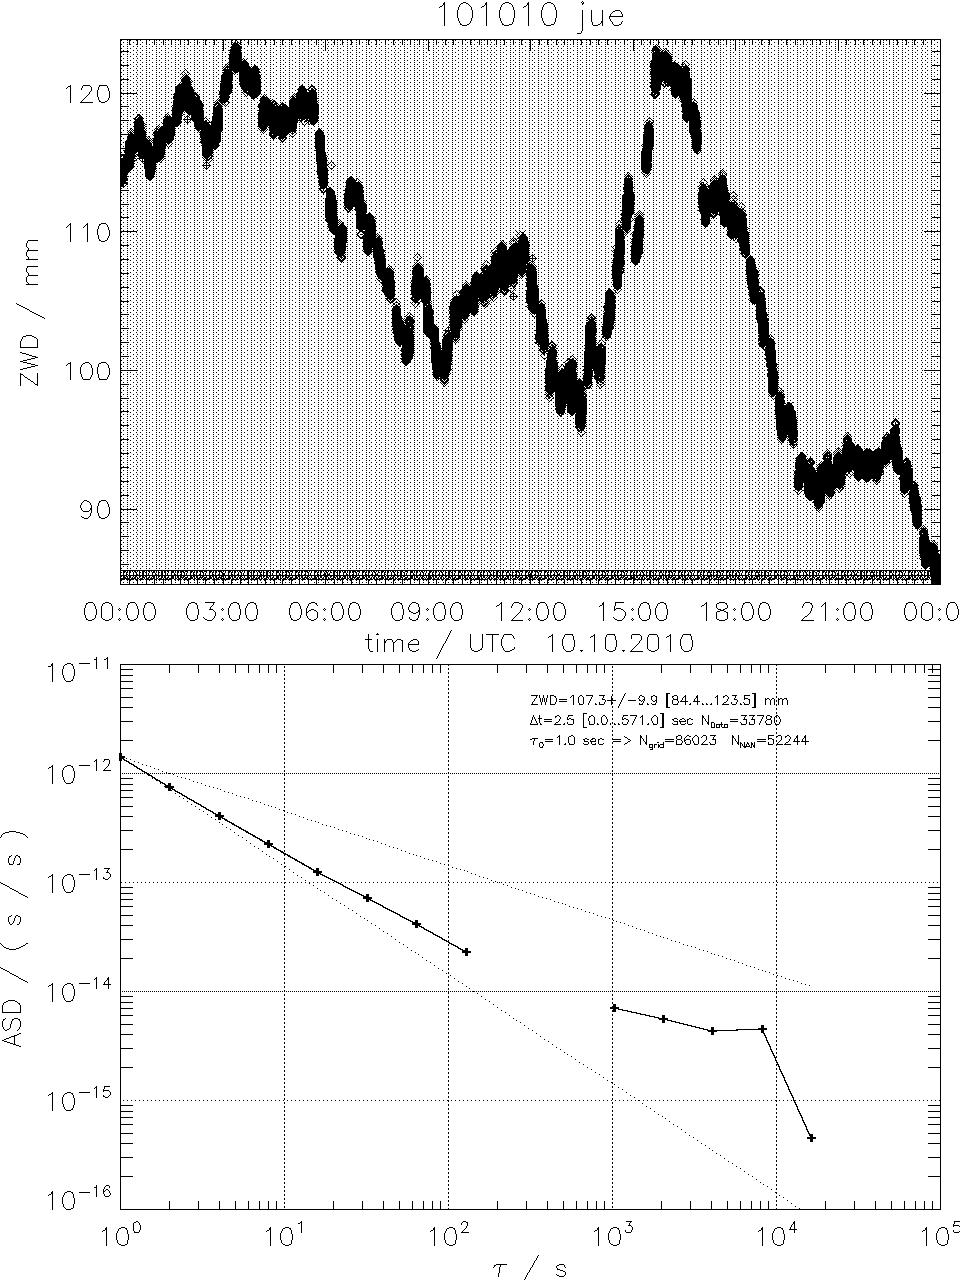
Plots show in the upper panel Zenith path wet delay (ZWD) as a function of time.
Vertical lines and letters indicate times of calibrations (N=noise, G=gain, T2|T3=Tipping curve).
Lower panel shows Allan standard deviation (ASD) as a function of time lag τ.
Brightness temperature (TB) at 23.8GHz is used to calculate zenith wet delay
(ZWD) in seconds via
ZWD=TB*2e-11s/K.
ZWD in mm results from multiplication by vacuum speed of light in mm/s.
Data series are copied to regular spaced grid with Δt=τ0=1sec
and Missing values are set to NAN.
Drift between calibrations is removed
to get rid of artefacts in original data.
Allan variance (AVAR) is calculated as
AVAR = σy2(nτ0,N) = (2(n τ0)2(N−2n))−1 Σi=0,N−2n−1 ( xi+2n − 2 xi+n + xi )2
With N = number of elements in data series and n = τ/τ0 the spacing in index with elements separated by τ in time.
Allan standard deviation is simply the square root.
White noise is based on the IDL pseudo random number genarator randn i.e. subsequent numbers are not correlated.
Red noise is generated with a marcov chain and has, if not indicated, an autocorrelatation length of T*=600sec,
i.e autocov(τ) = <TB'(t) TB'(t+τ)>/<TB'(t)2> = e−τ/T*.
It is generated via
TBi = q TBi−1 + (1-q2)1/2 Z(0,σ) + TBm
With q = e−τ0/Tx and Z(0,σ) a standard normal distributed randnom number with mean 0 and standard deviation σ.
Mixed noise is the sum of white and red noise with indicated standard deviations and autocorrelation length.
Dashed lines are theoretical ASD depencies
with τ-0.5 for pure red noise and τ<T*
and τ-1 for pure white noise.
Implematation in IDL:
f_allan_var_time.pro
pl_zwd_allan_sdv.pro