smoothed calibration steps
Signal from MWR HATPRO shows jumps after calibration.
We assume that the first measurement S0 after a calibration at t=t0 is exact.
After a calibration the instrument starts to drift linear with time.
A linear fit is applied to data between two calibrations and extrapolated to
time of the following calibration. Difference of this extrapolation Sx to t0
after the following calibration divided by elapsed time tx-t0 gives driftrate D.
Corrected signal is
S'(t) = S(t) - D*(t-t0)
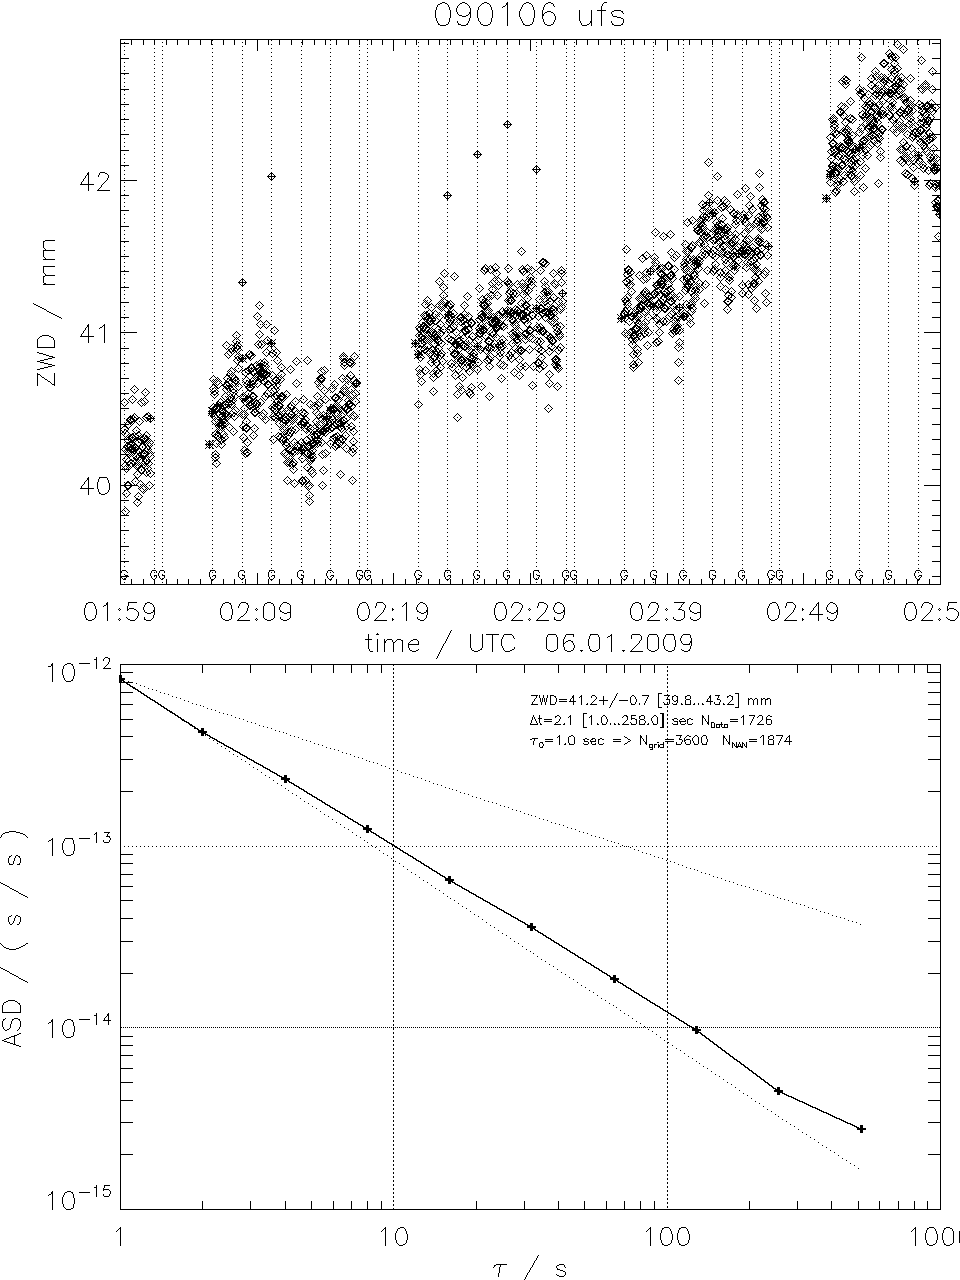
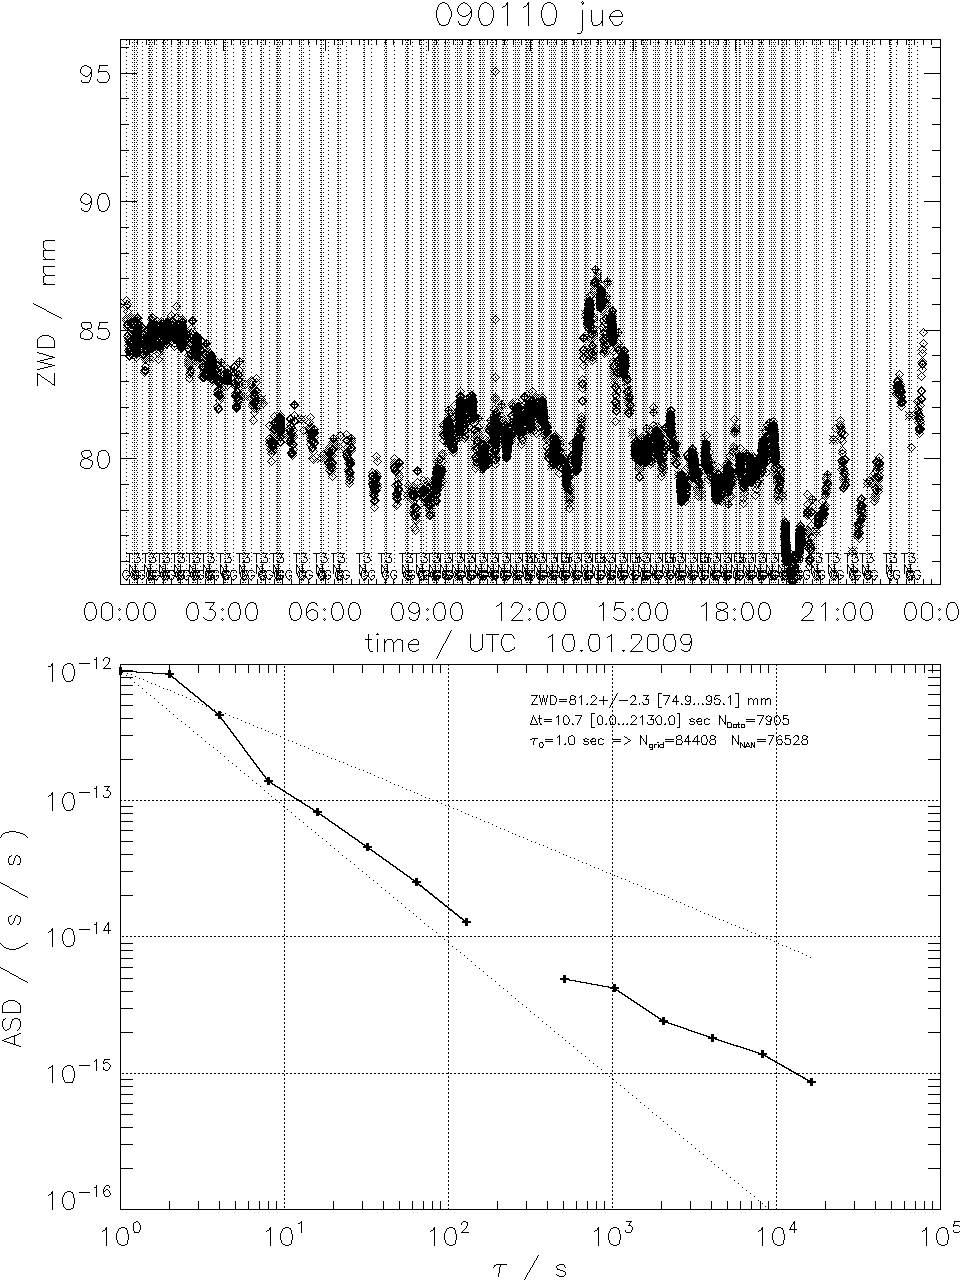
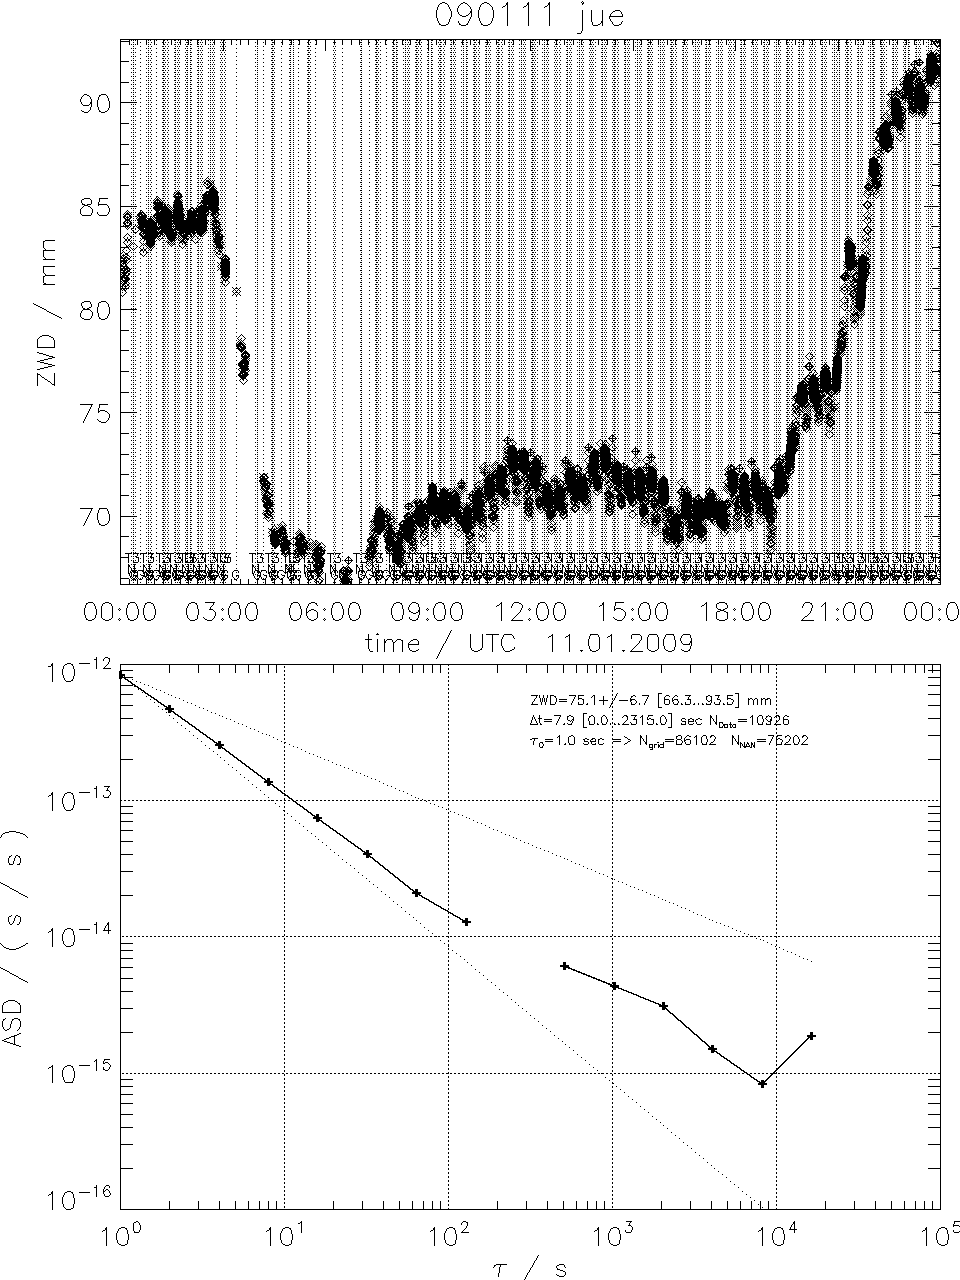
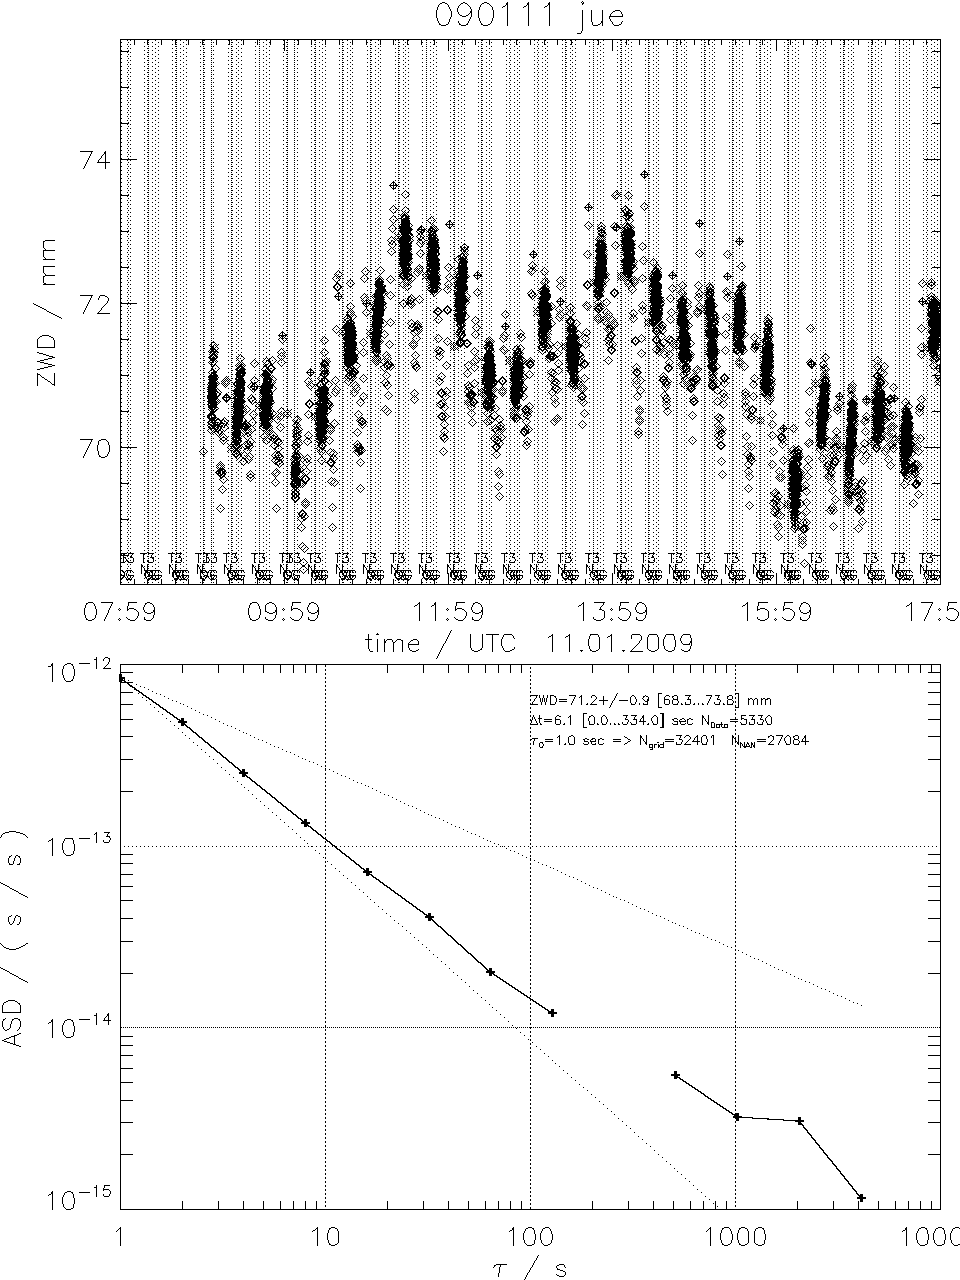
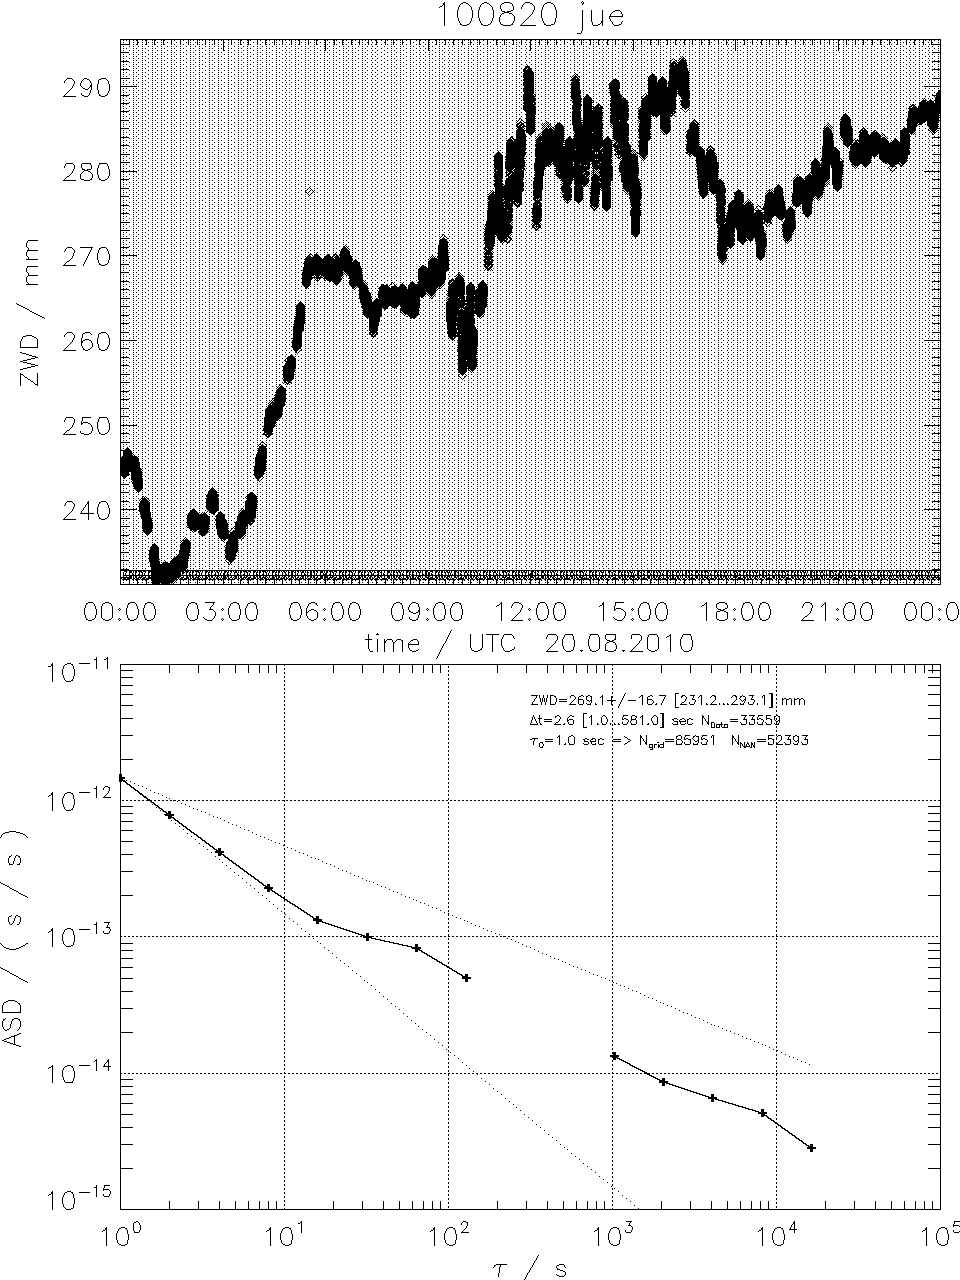
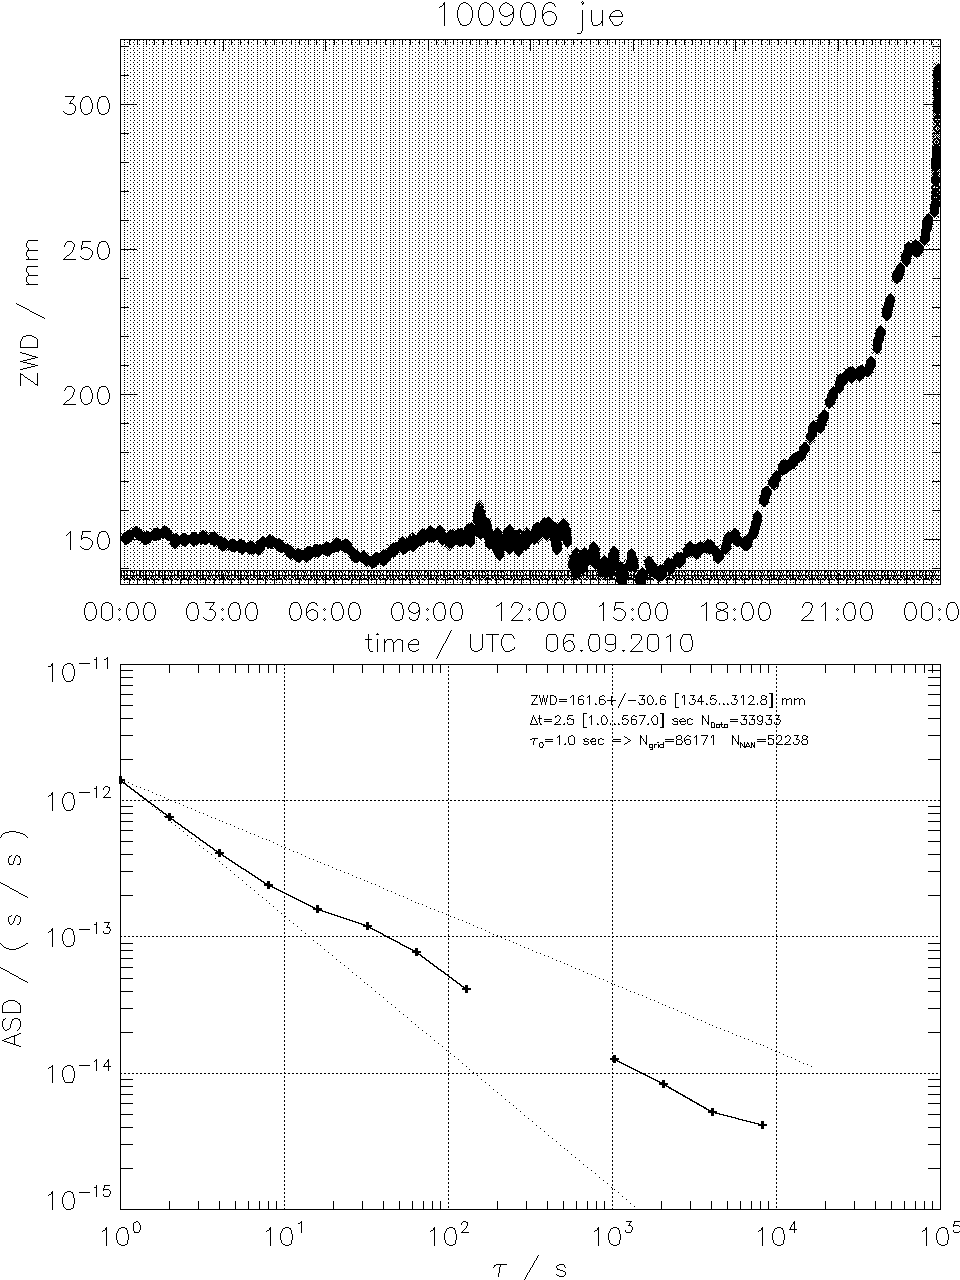
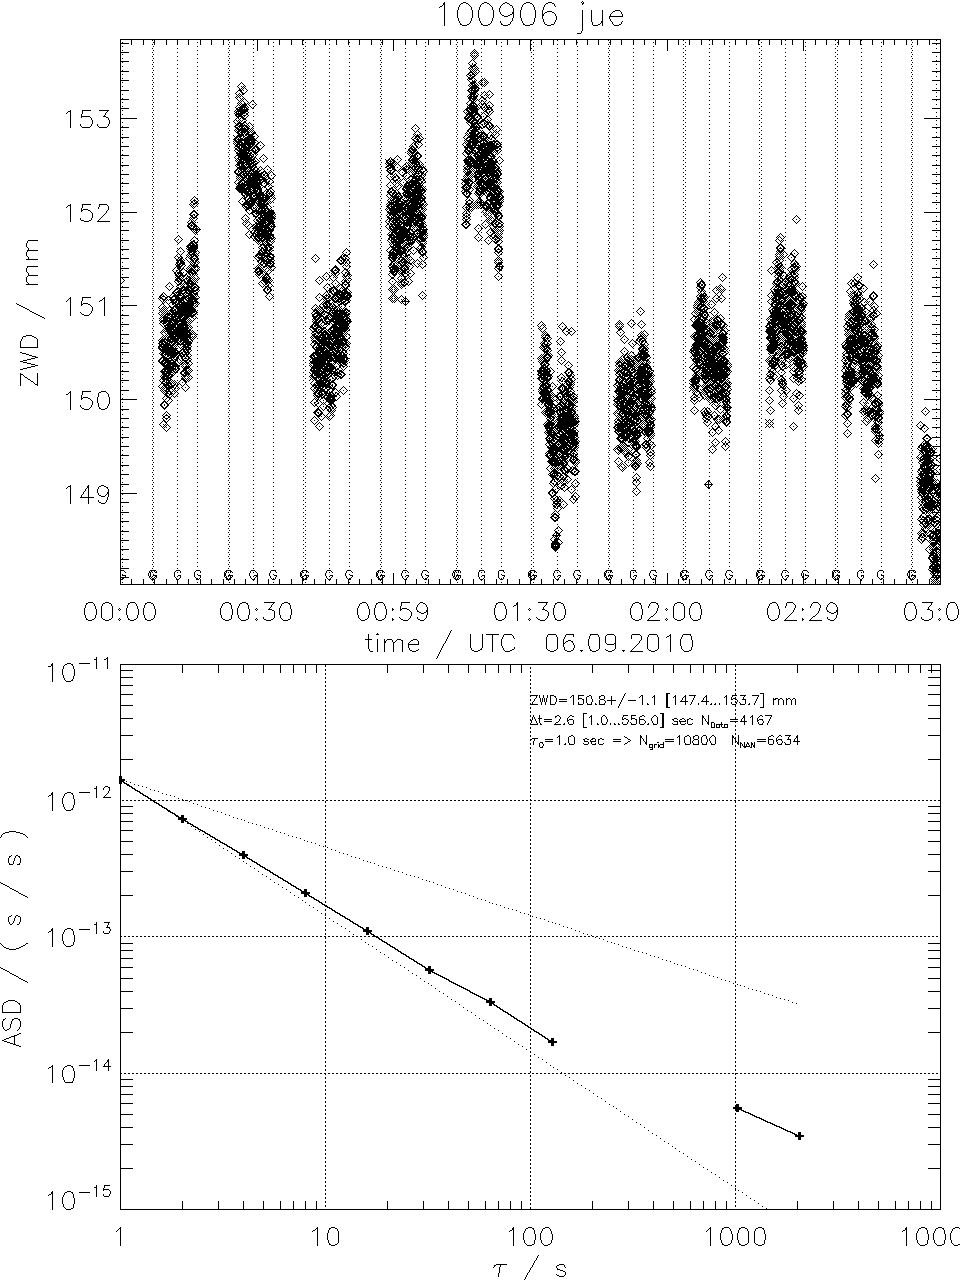
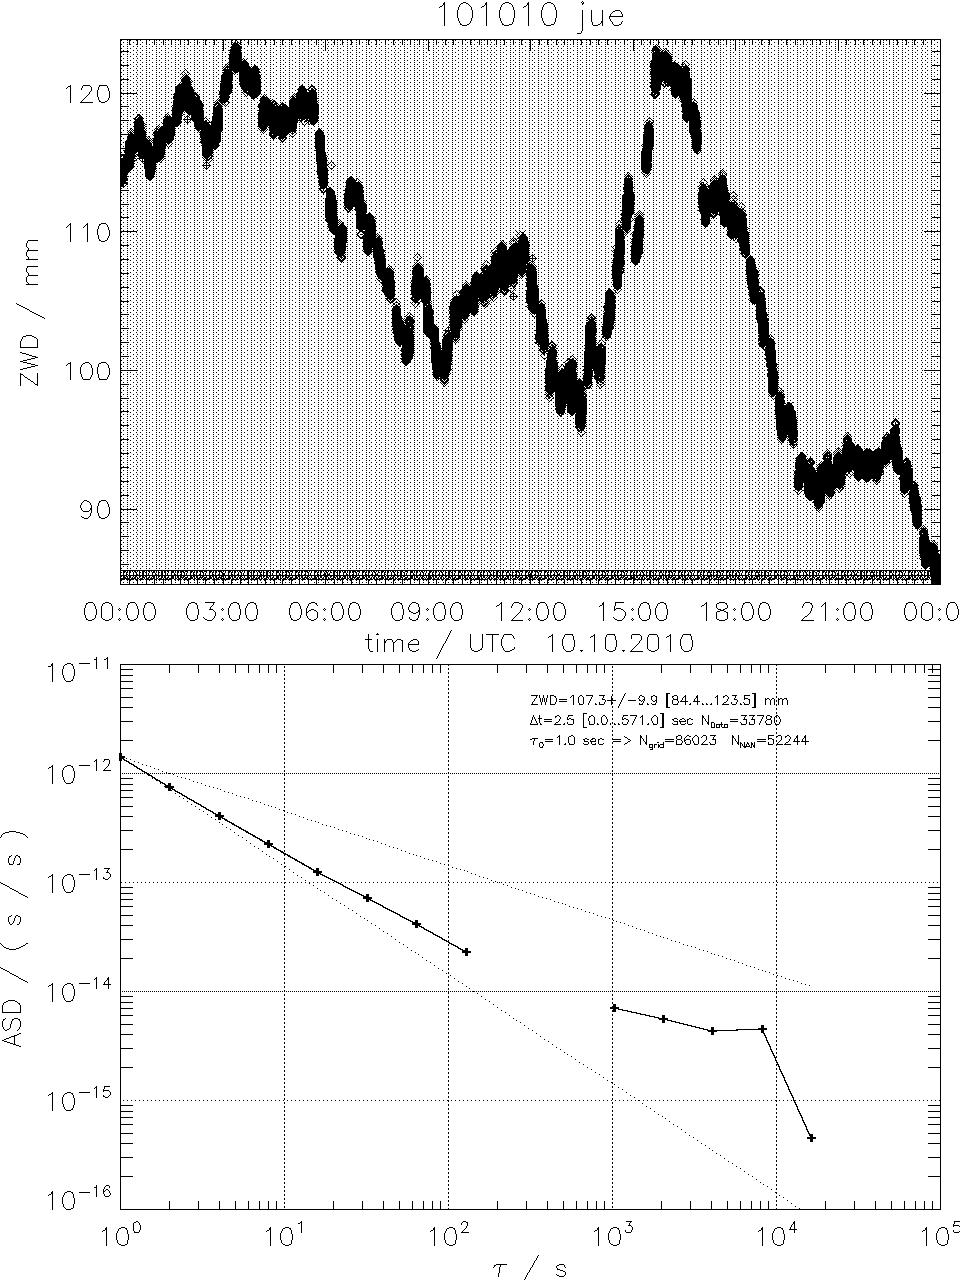
Below are examples from SNOHAT during a cloudfree dry day at UFS/Mt.Zugspitze. ZWD is estimated from ZWD = A*TB(23..GHz). Letters at the bottom of upper plots indicate times of gain calibrations (G), noise diode calibrations (N) and tipping curve calibrations (T2 or T3). Signal shows a typical saw tooth structure with jumps at times of calibrations which is removed in the corrected signal. Jumps after tipping curve calibration remain as there is only one datapoint in the time interval before the tipping calibration and no linear fit is possible.
Correction of the signal removes the increased ASD values around 60sec.
| time | original data | corrected signal |
|---|---|---|
| UFS | ||
| UFS 6.1.2009 02-03UTC | 
| 
|
| UFS 6.1.2009 02-05UTC | 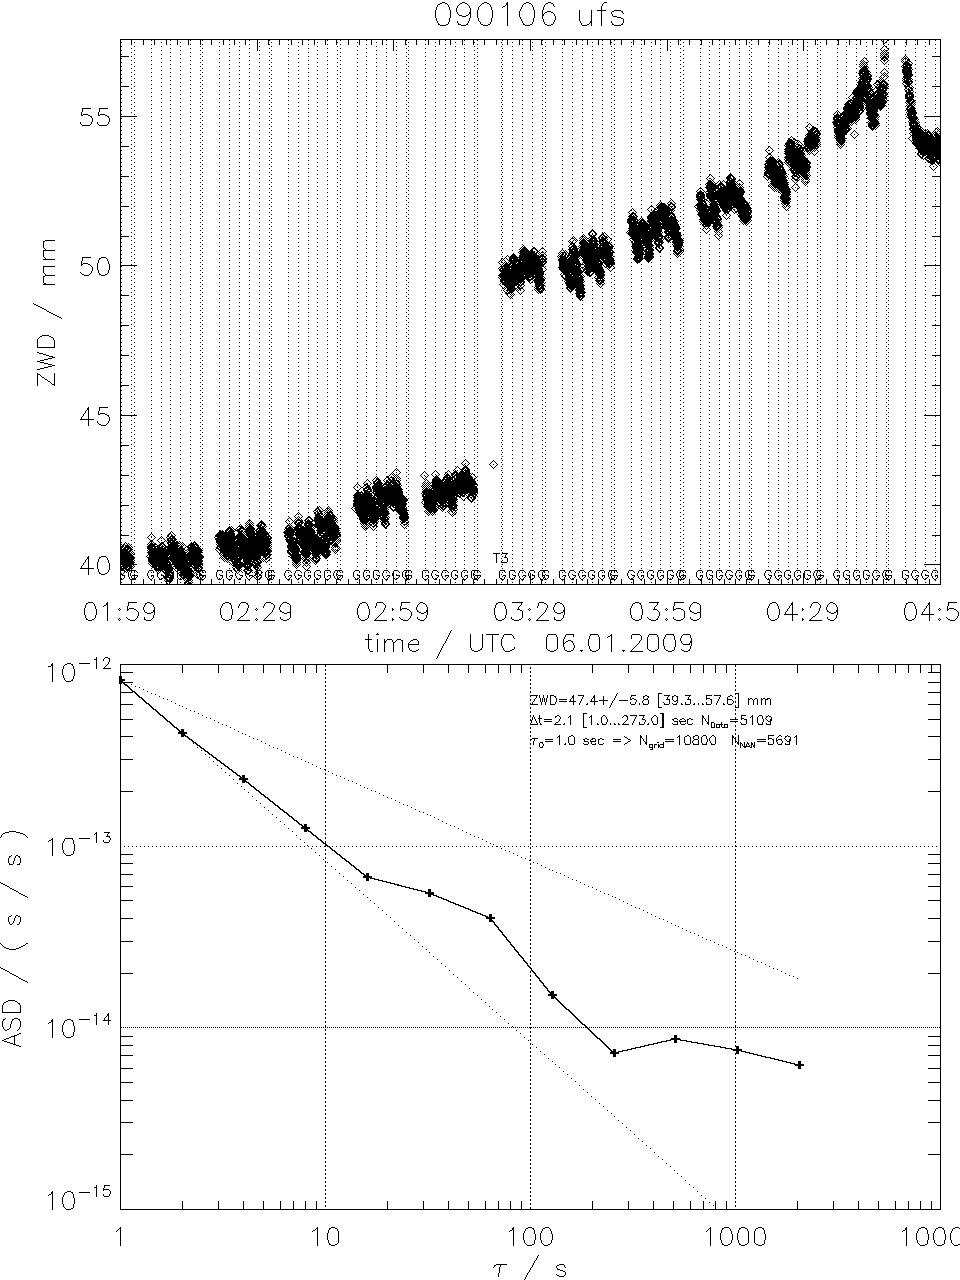
| 
|
| UFS 6.1.2009 00-24UTC | 
| 
|
| SUNHAT @ JUE | ||
| JUE 10.1.2009 | 
| 
|
| JUE 11.1.2009 | 
| 
|
| JUE 11.1.2009 09-18UTC | 
| 
|
| TOPHAT @ JUE | ||
| JUE 20.8.2010 | 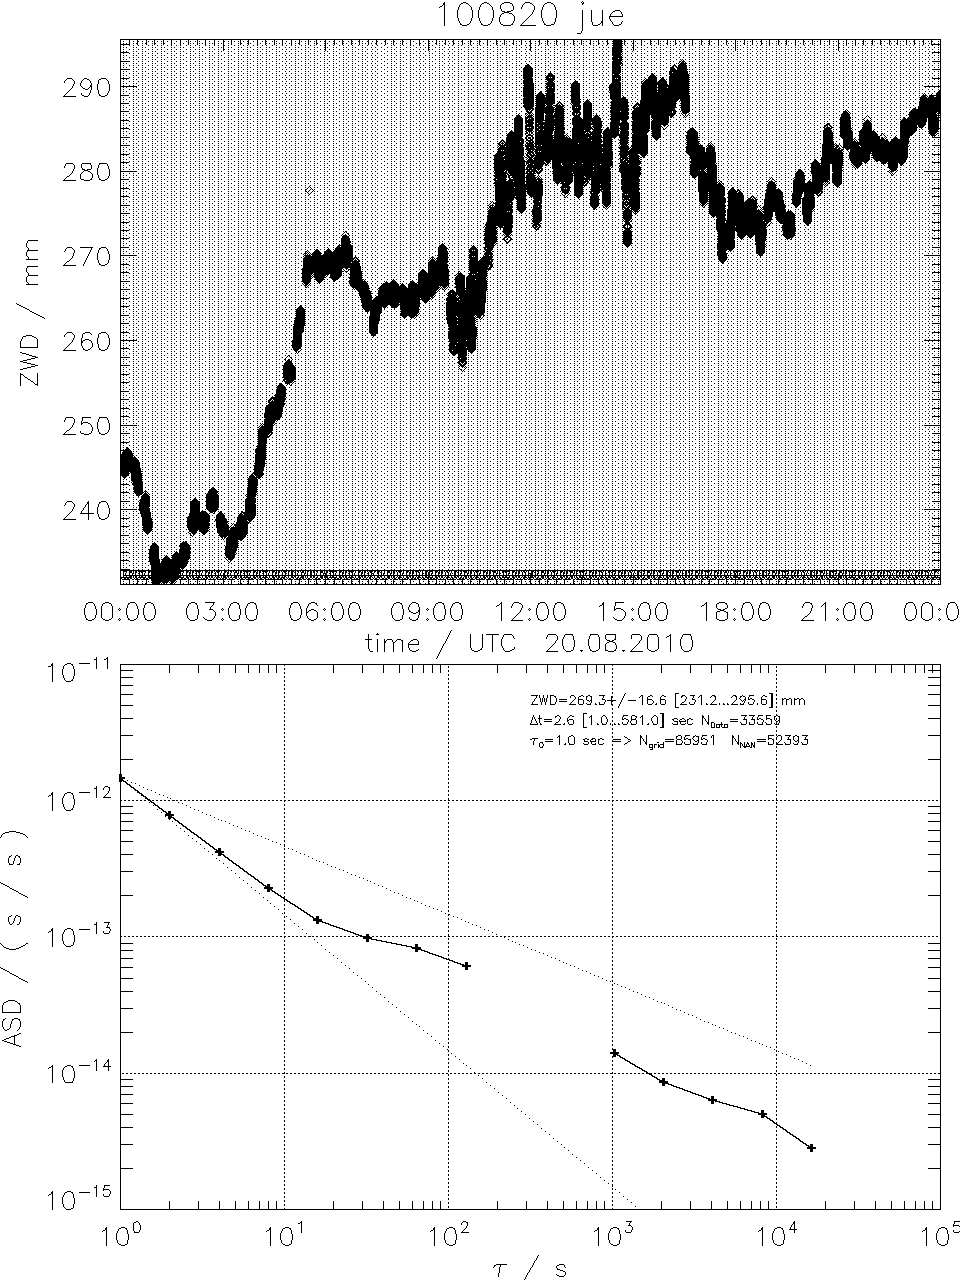
| 
| JUE 6.9.2010 | 
| 
| JUE 6.9.2010 00-03UTC | 
| 
| JUE 10.10.2010 | 
| 
|