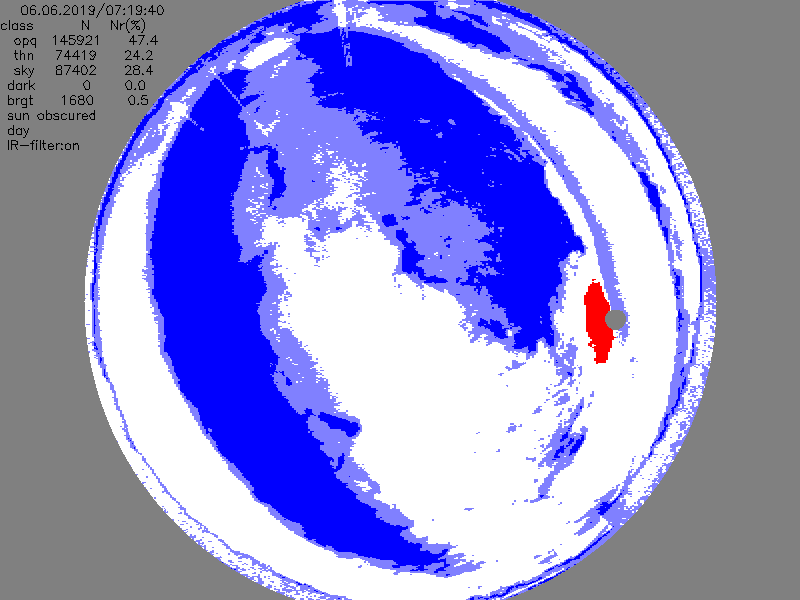
Test cloud mask
too dark |
sky |
thin clouds |
thick clouds |
too bright |
move your mouse over the image
First attempt for a cloudmask based on two thresholds for the blue/red ratio:
opaque cloud: b/r ≤ tsopq
thin cloud: tsopq < b/r ≤ tssky
sky : tssky < b/r
with tssky=1.2 and tsopq=1.05 (or something similar :-)
Too dark pixels are identified with max(r,g,b) < tsdark
and too bright pixels i.e. pixels which are close to saturation are determined with min(r,g,b) > tsbright
with tsdark=100 and tsbright=253
The cloudmask itself is stored as a 8bit png image with color pallette, i.e. the bimtap itself contains integers indexing the class.
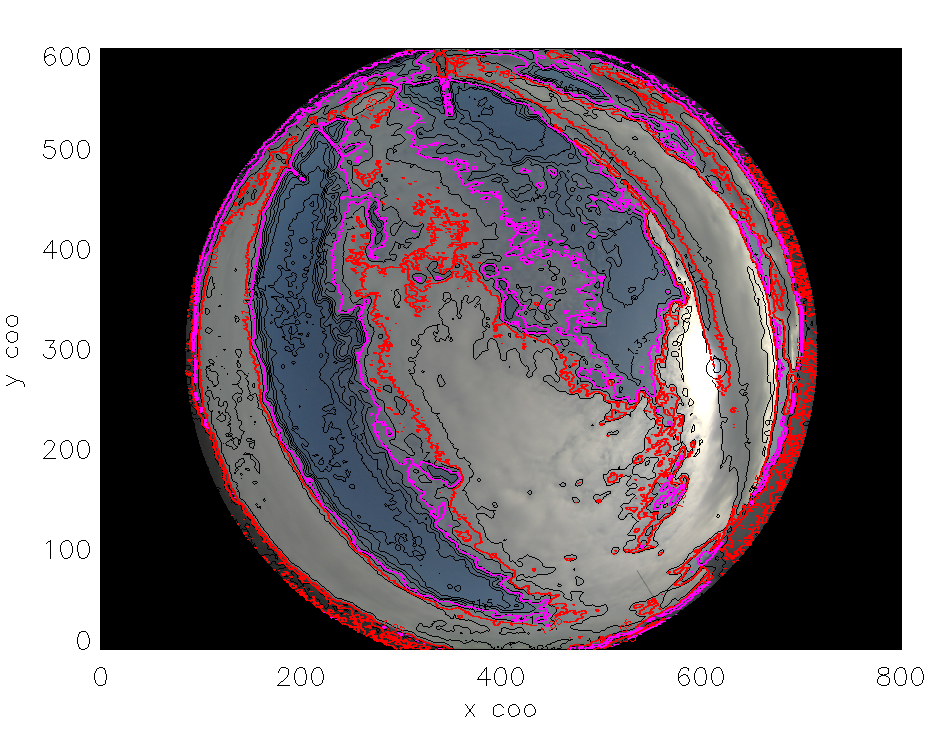
Contour lines of b/r ratio overlayed over last image of sequence. Magenta identifies tssky and red tsopq.
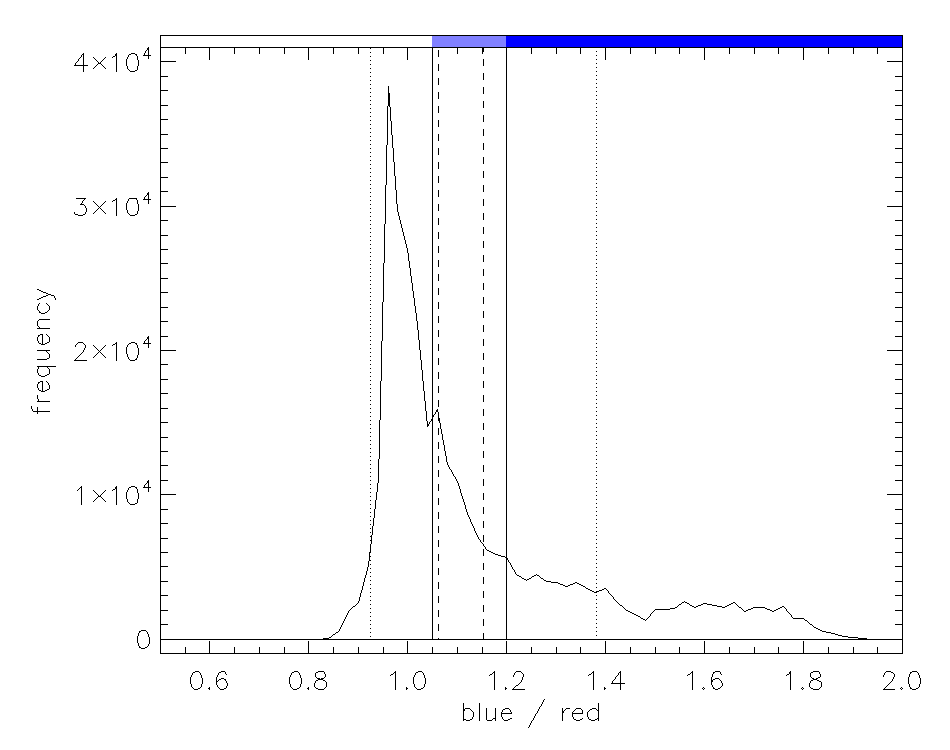
Histogram of blue to red ratios in the last image of the sequence (too dark and too bright pixels excluded). Vertical solid lines mark tssky and tsopq,
vertical dashed are mean and median, dotted is mean ± stddev.
Curve has two principal maxima: to the left for b/r around 1 the cloud pixels and to the right for b/r around 1.5 the sky pixels.
Somewhere between the two maxima are b/r values related to pixels showing thin clouds.
There has been a paper suggesting to analyse this histogram for the dermination of tssky.
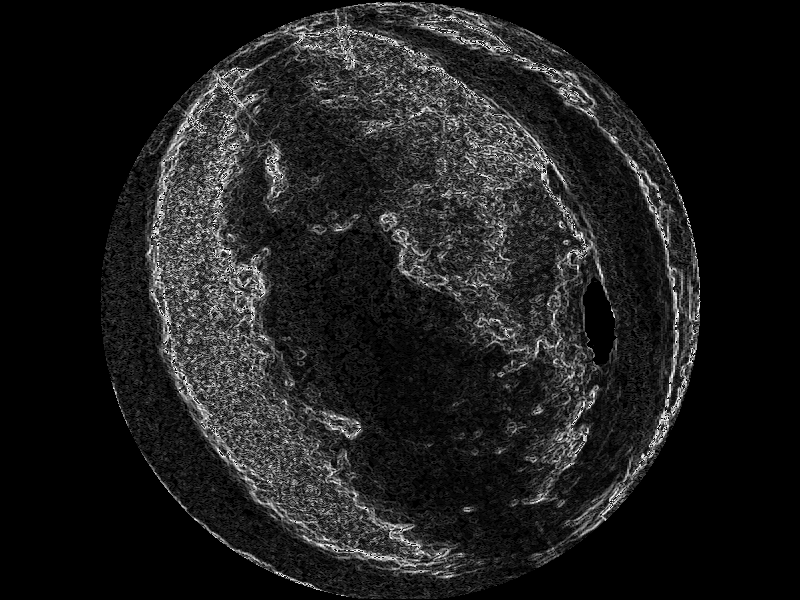
Left: normalized blue to red ratio. Right: normalized absolute gradient
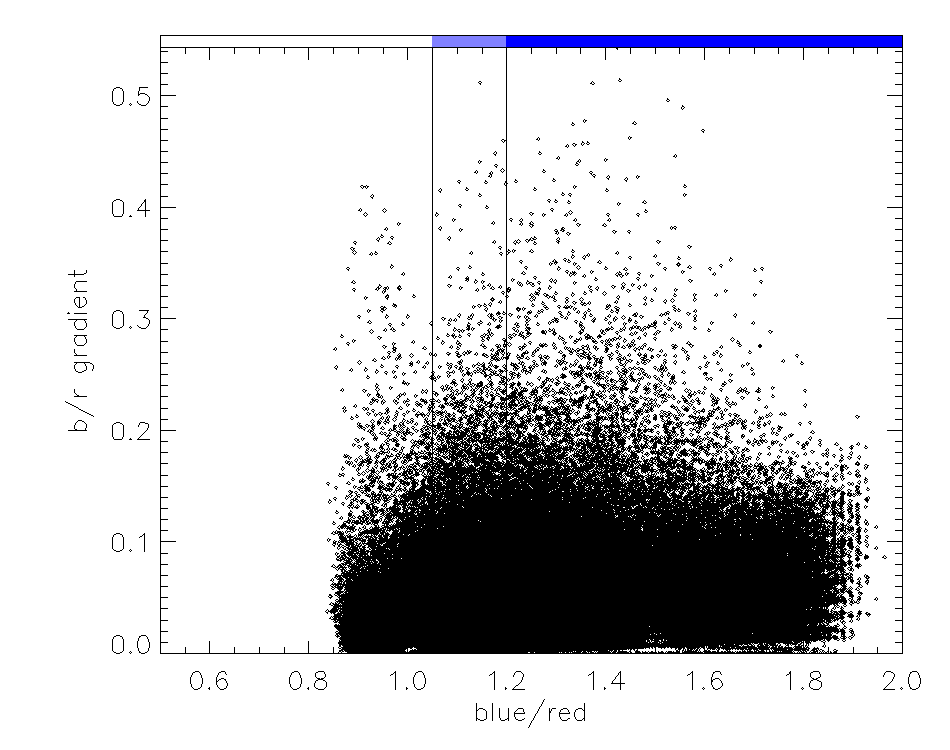
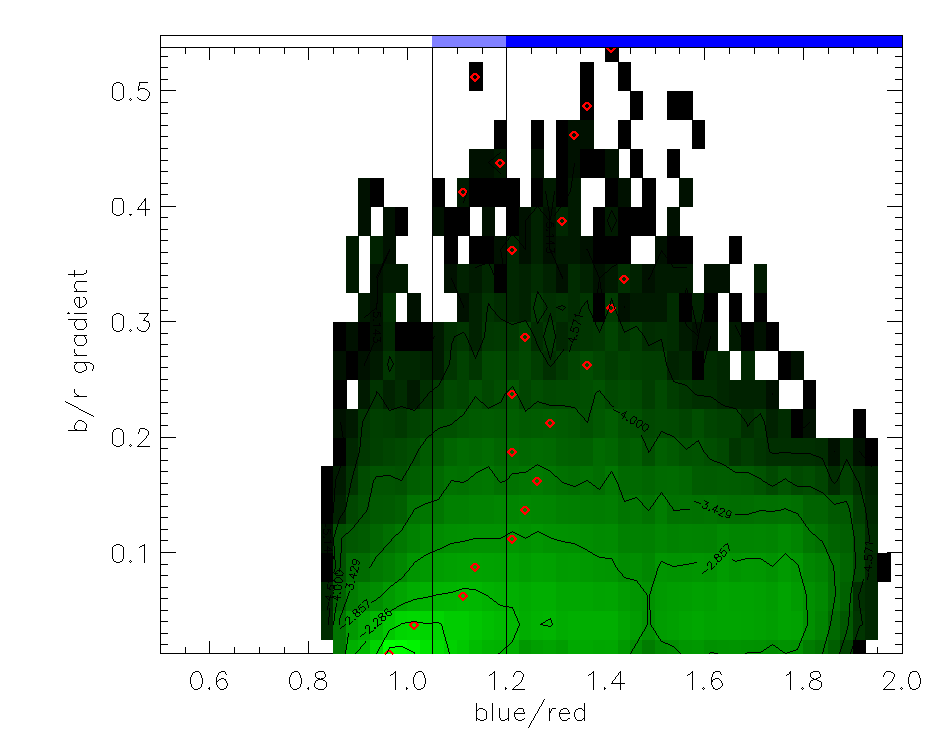
b/r-gradient versus b/r: scatterplot (left) and 2D-histogram (log10(pdf) right)