Wind from TSI
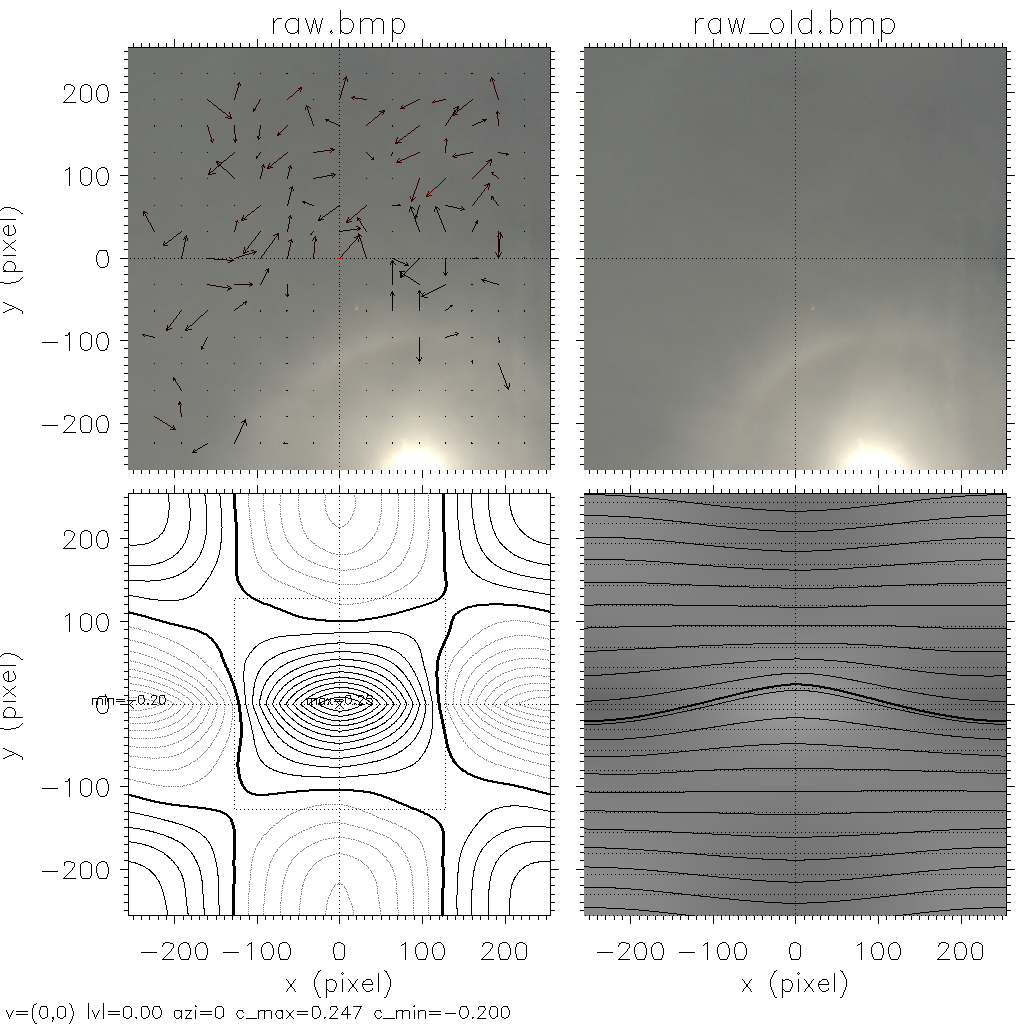
Wind derived from two consecutive images.
Top: the two images (45deg around zenith, rectified),
bottom: cross-correlation between these two images as isolines (left with 0.02 spacing) and grayscale (right, black=-1, white=+1).
The maximum in the cross correlation idenditfies the shift to achieve maximum agreement between both images
In the center of the images this is vector drawn in thick - if it could be derived.
Wind field is derived from sub-images. Color indicates correlation between shifted sub image: black=low correlation, red=high correlation.
One would expect the higher the correlaton the better the wind ...
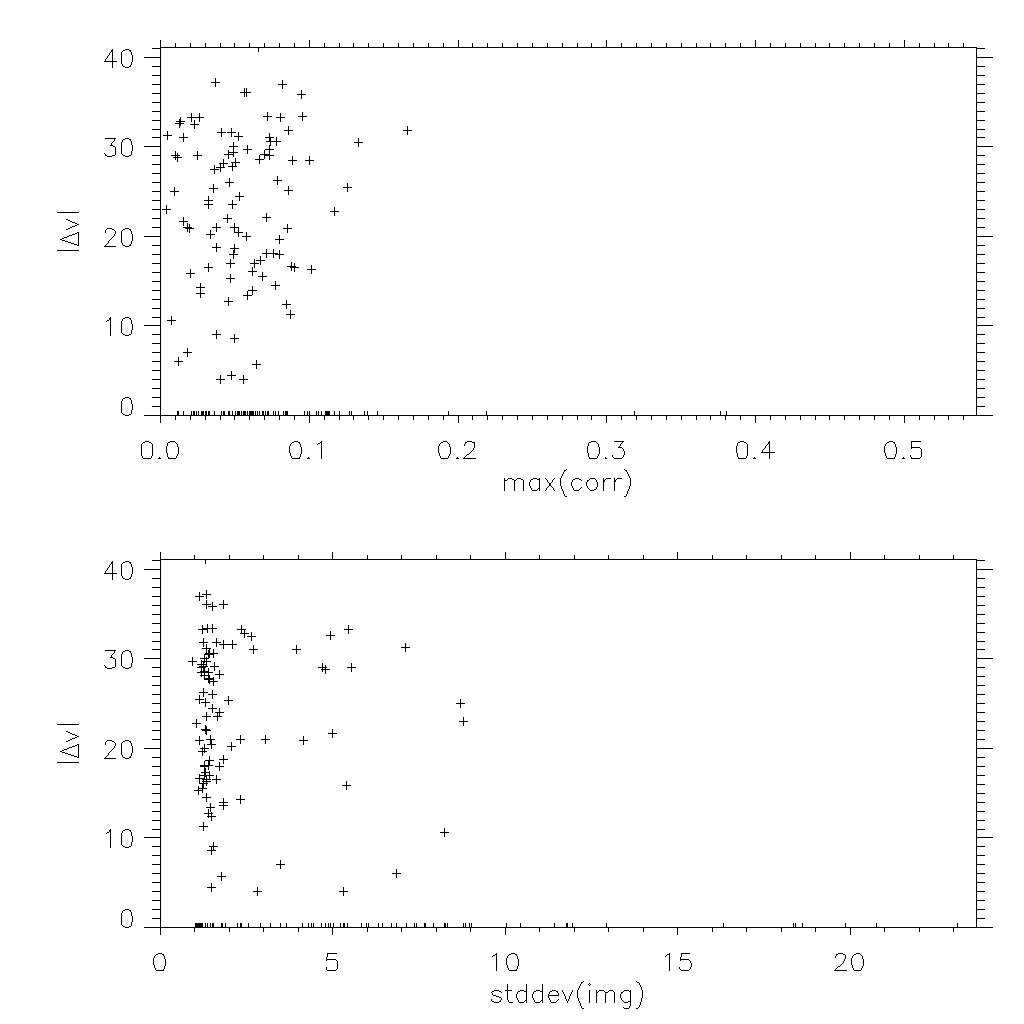
Deviation of sub images shifts from overall shift as function of max correlation.
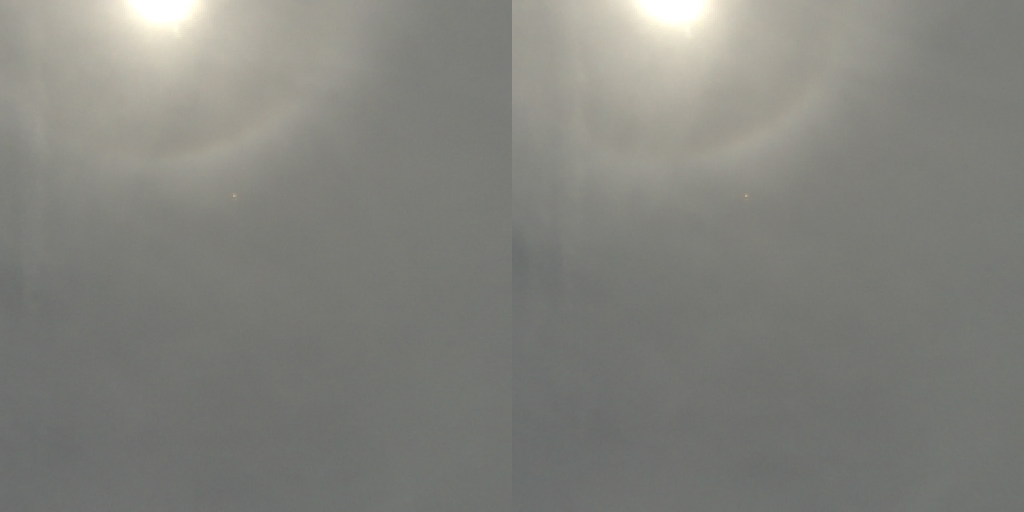
Both images rotate such that shift is on x-axis => can be viewed by crossed-eye-method