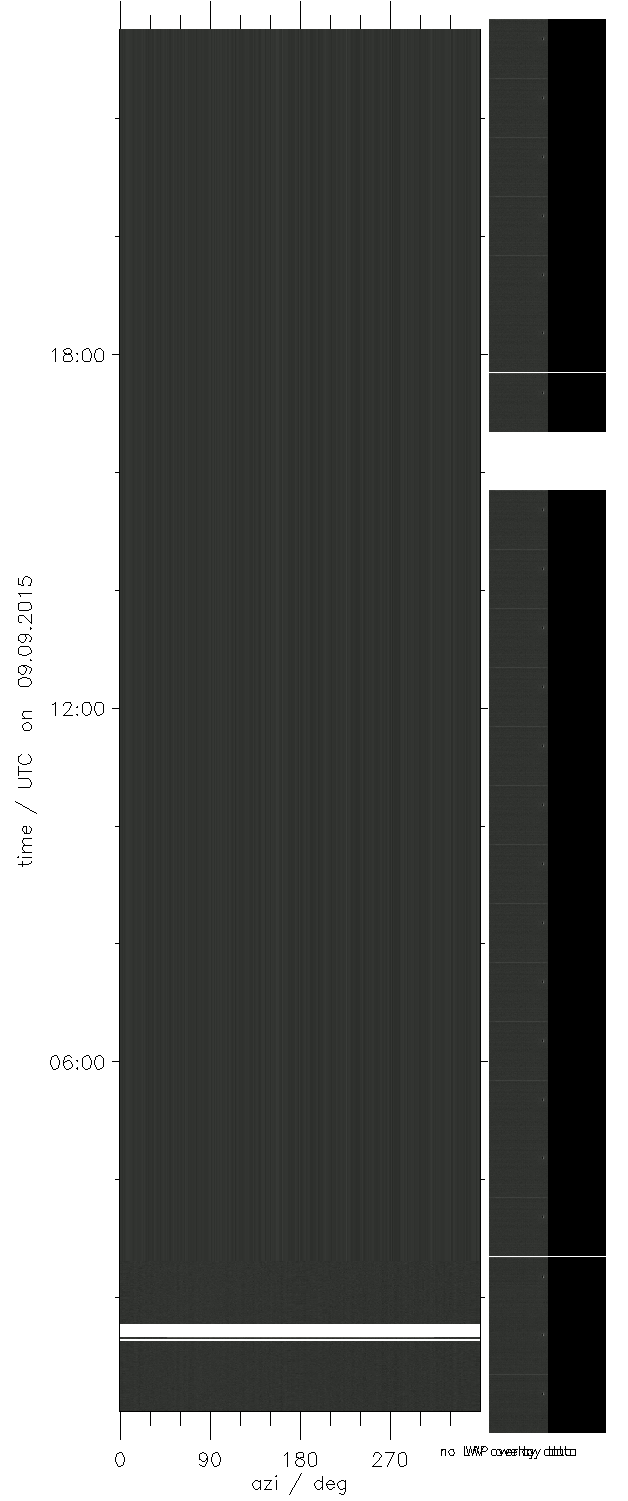
Time-azimuth plot at 30° elevation from TSI (colorimage) overlayed with LWP from
scanning HATPRO radiometer (isolines). Dots mark measuring points from HATPRO,
thin dots indicate flagged data not used for the overlay.
Time-azimuth plot at 30° elevation from TSI (colorimage) overlayed with LWP from
scanning HATPRO radiometer (isolines). Dots mark measuring points from HATPRO,
thin dots indicate flagged data not used for the overlay.
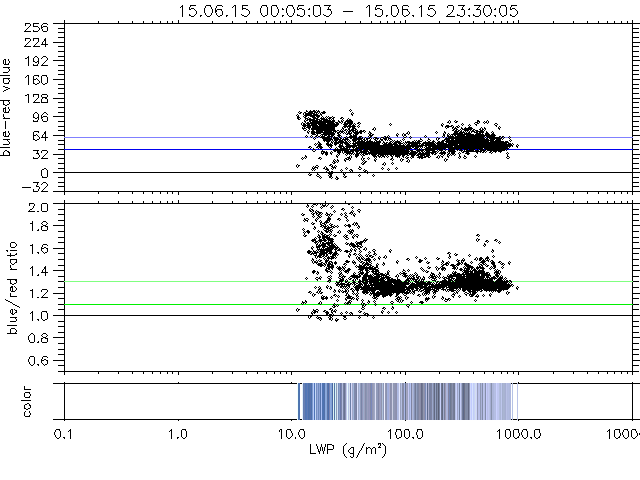
Blue-red difference (top), blue/red ratio (middle) and pixel color (bottom) as a function of LWP.
Solid lines represent cloud discrimintation borders of the TSI (see below).
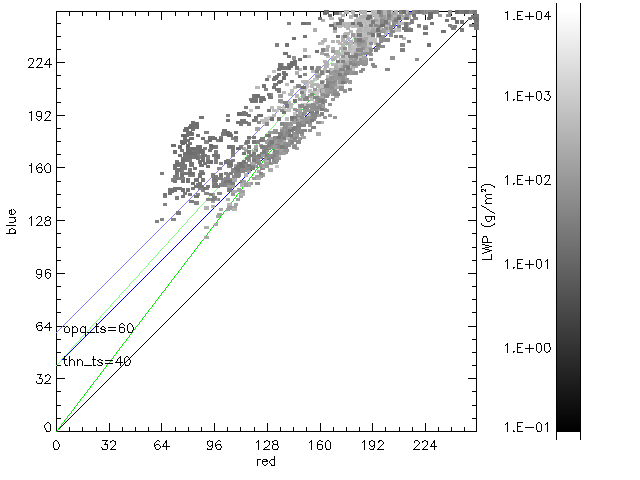
LWP values in red-blue plane. Solid colored lines represent cloud discrimintation borders of the TSI based on
paramers opaque (opq_ts) and thin cloud (thn_ts) threshold. The detailed algoritm is not published by the
manufacturer but it seems as if most opaque cloud classified pixels lie below the lower green line and
thin cloud pixels lie between the two green lines and everything above is blue sky.