| transsect | stat1 | stat2 | stat3 | stat4 | stat5 |
|---|---|---|---|---|---|
| 2 |
|
|
|
|
|
| 1 |
|
|
|
|
|
| 3 |
|
|
|
| |
| AP |
|
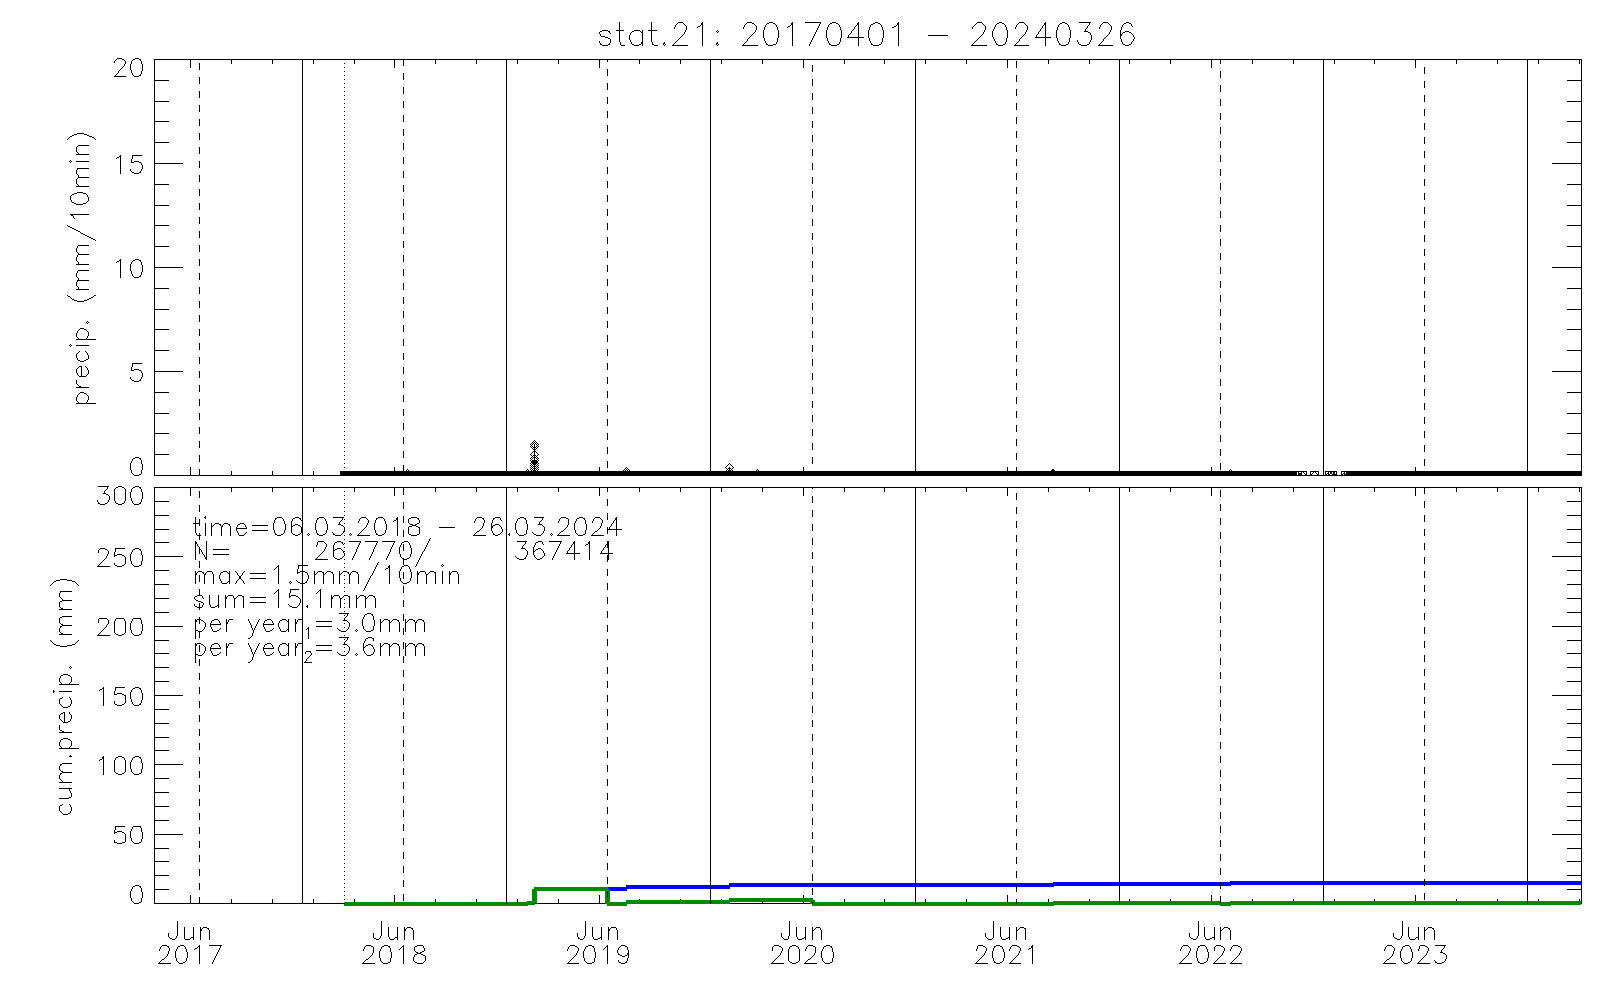
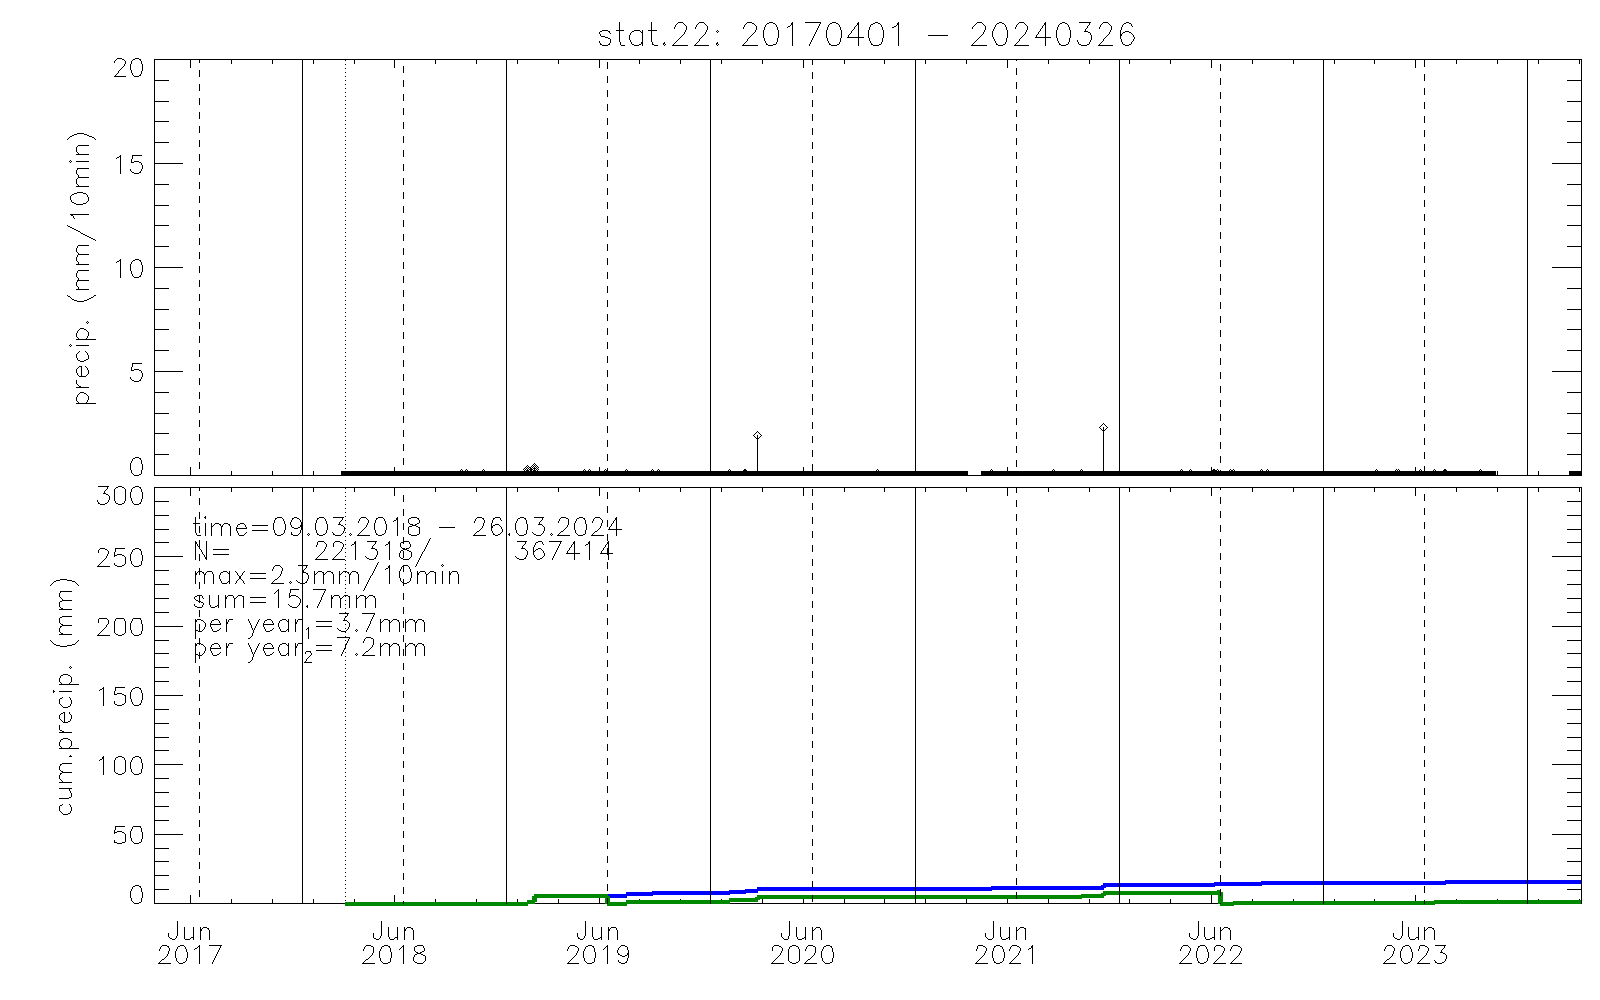
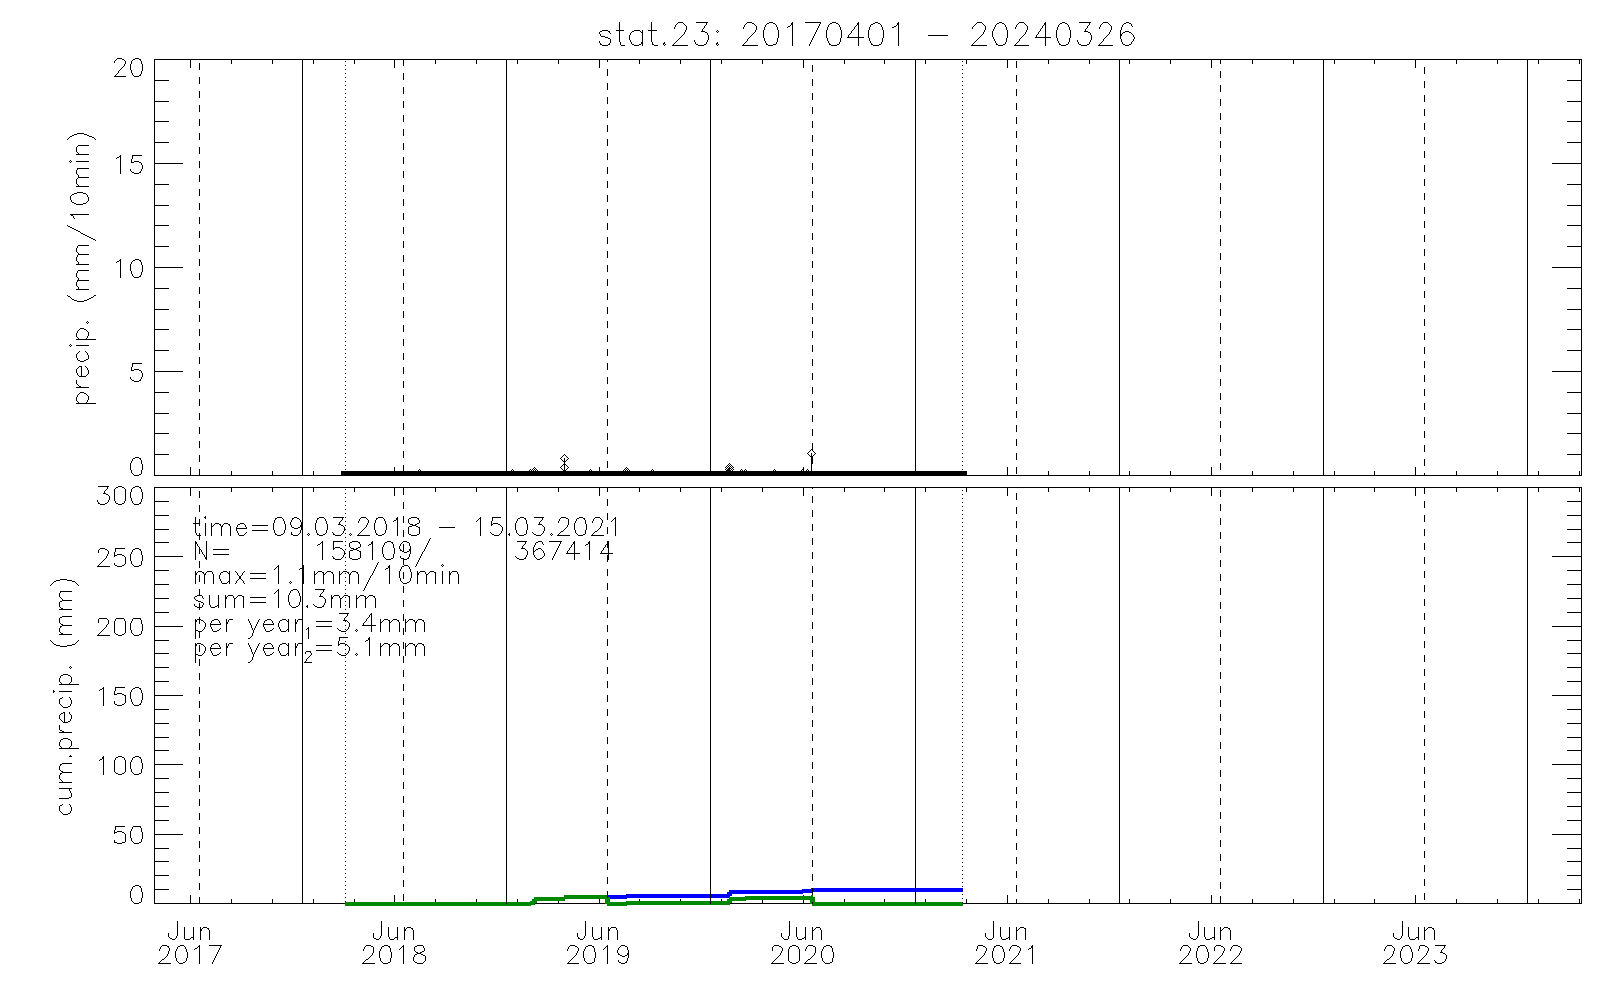
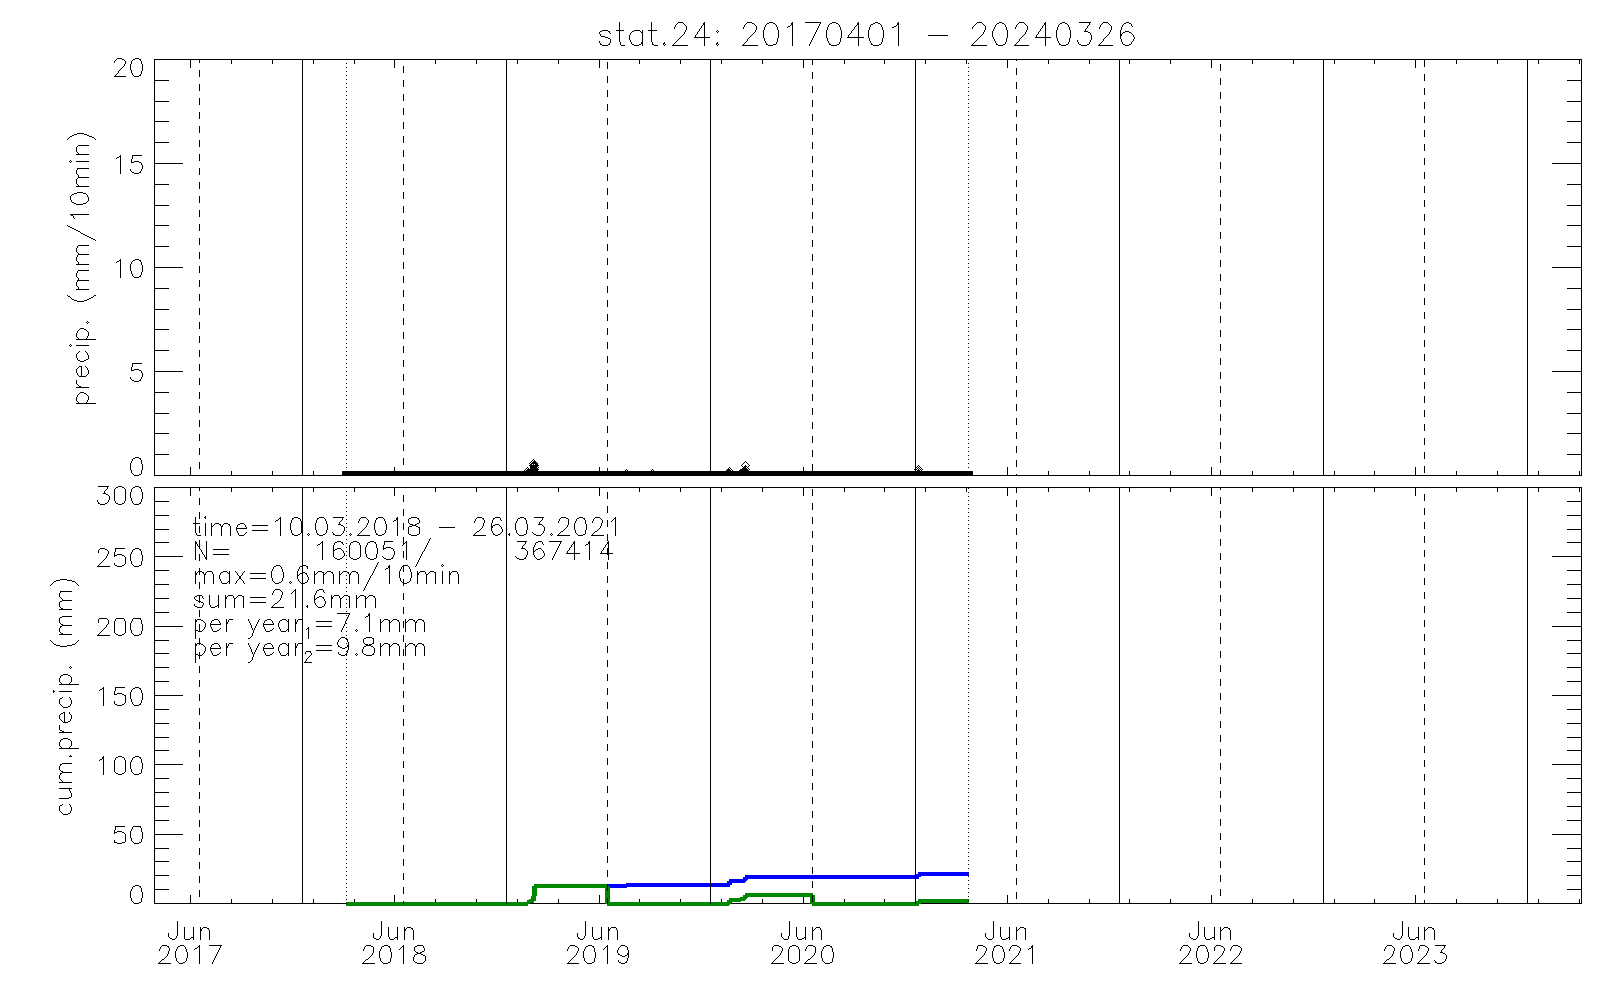
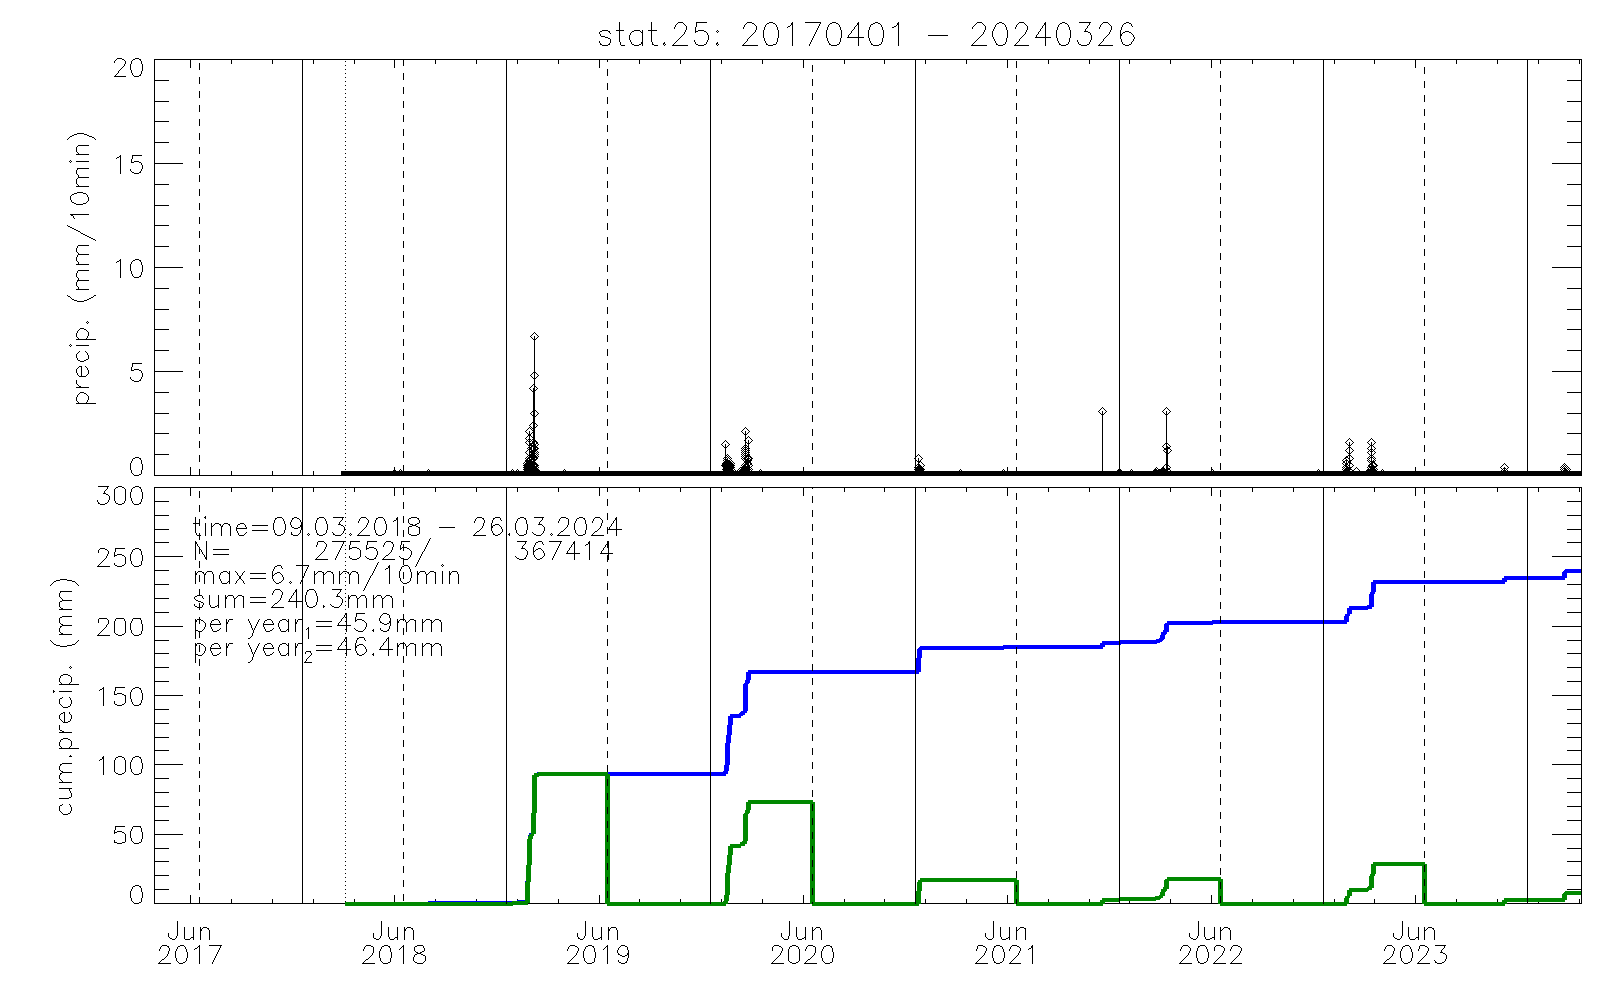
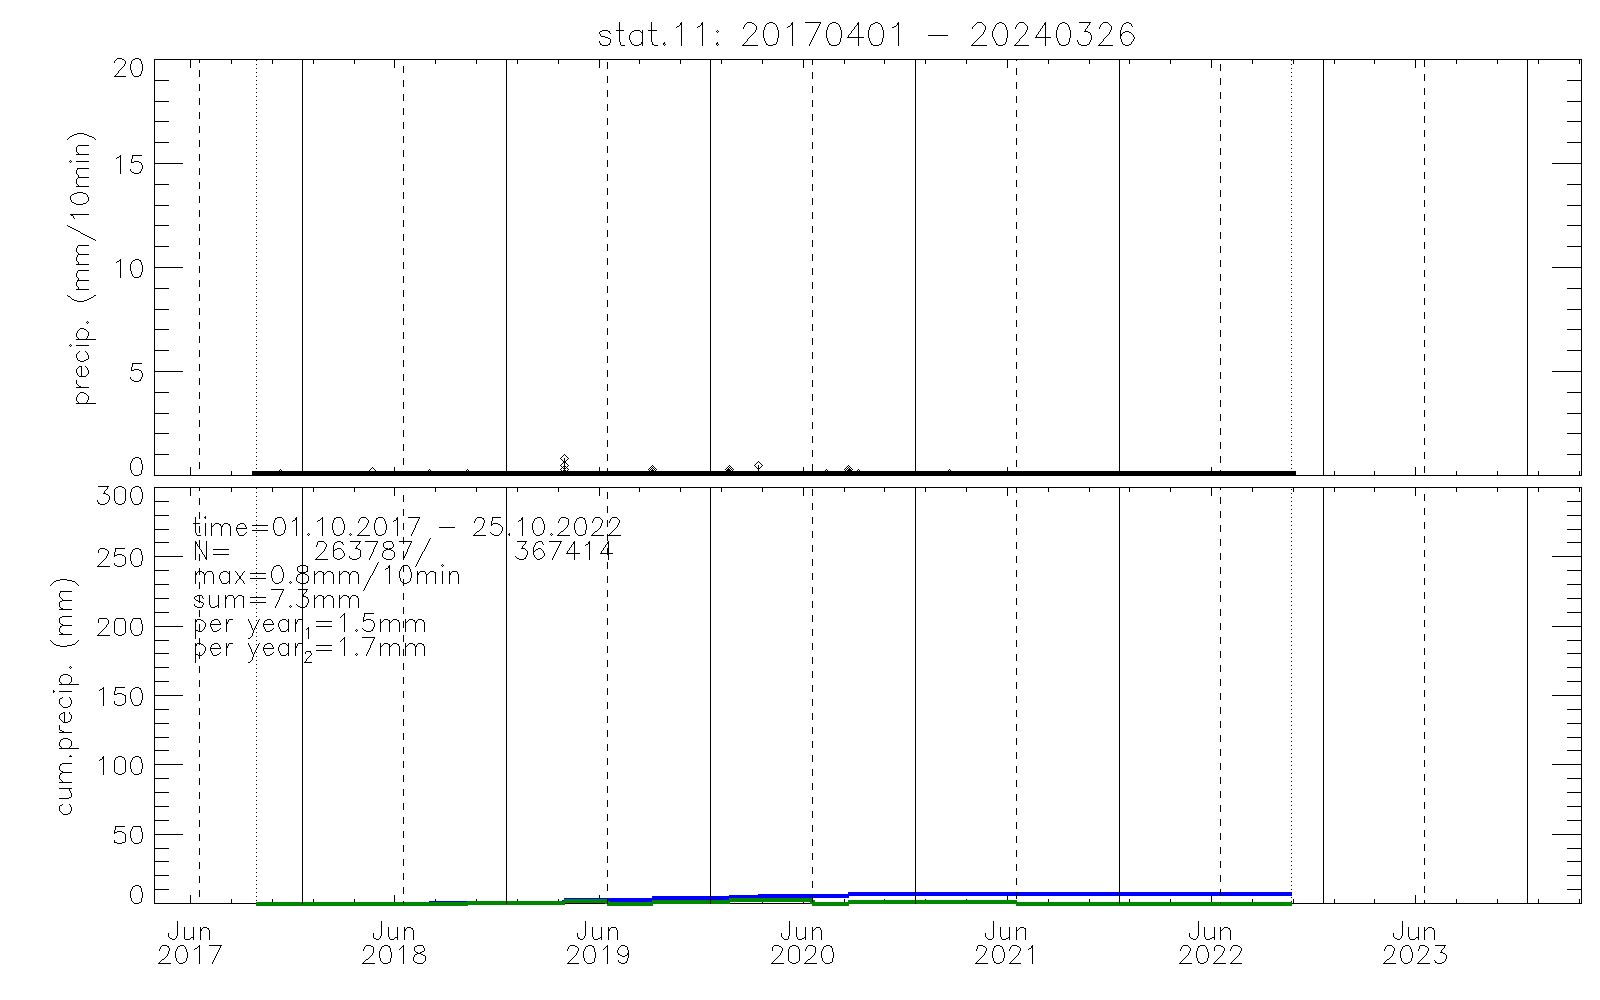
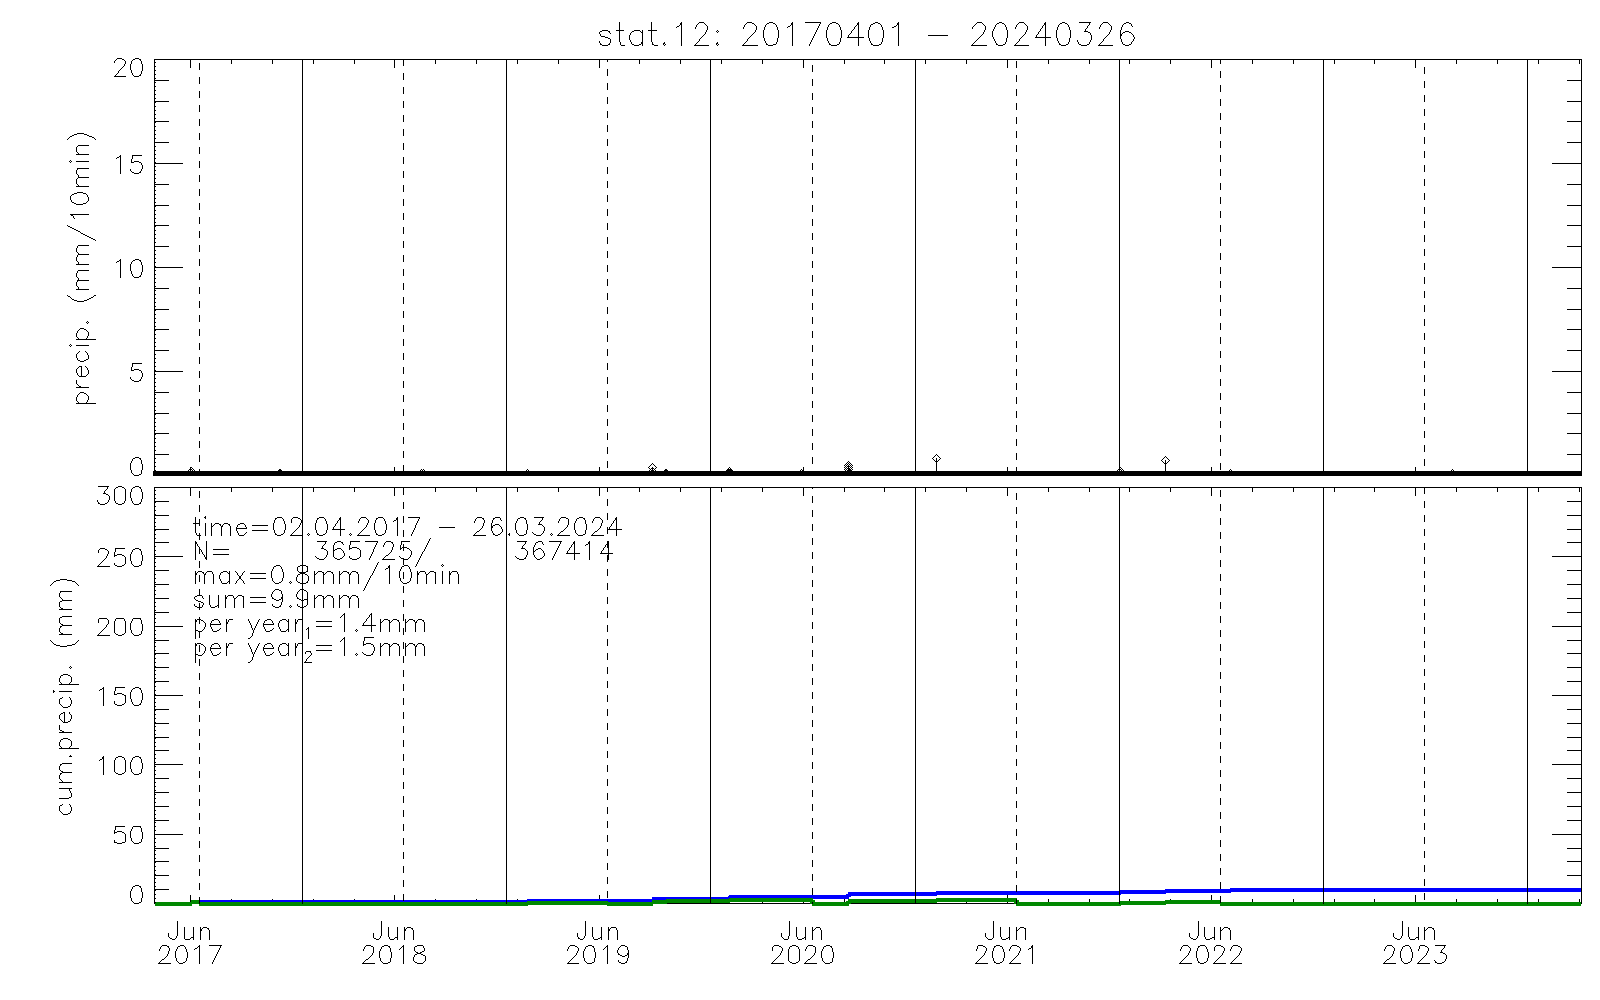
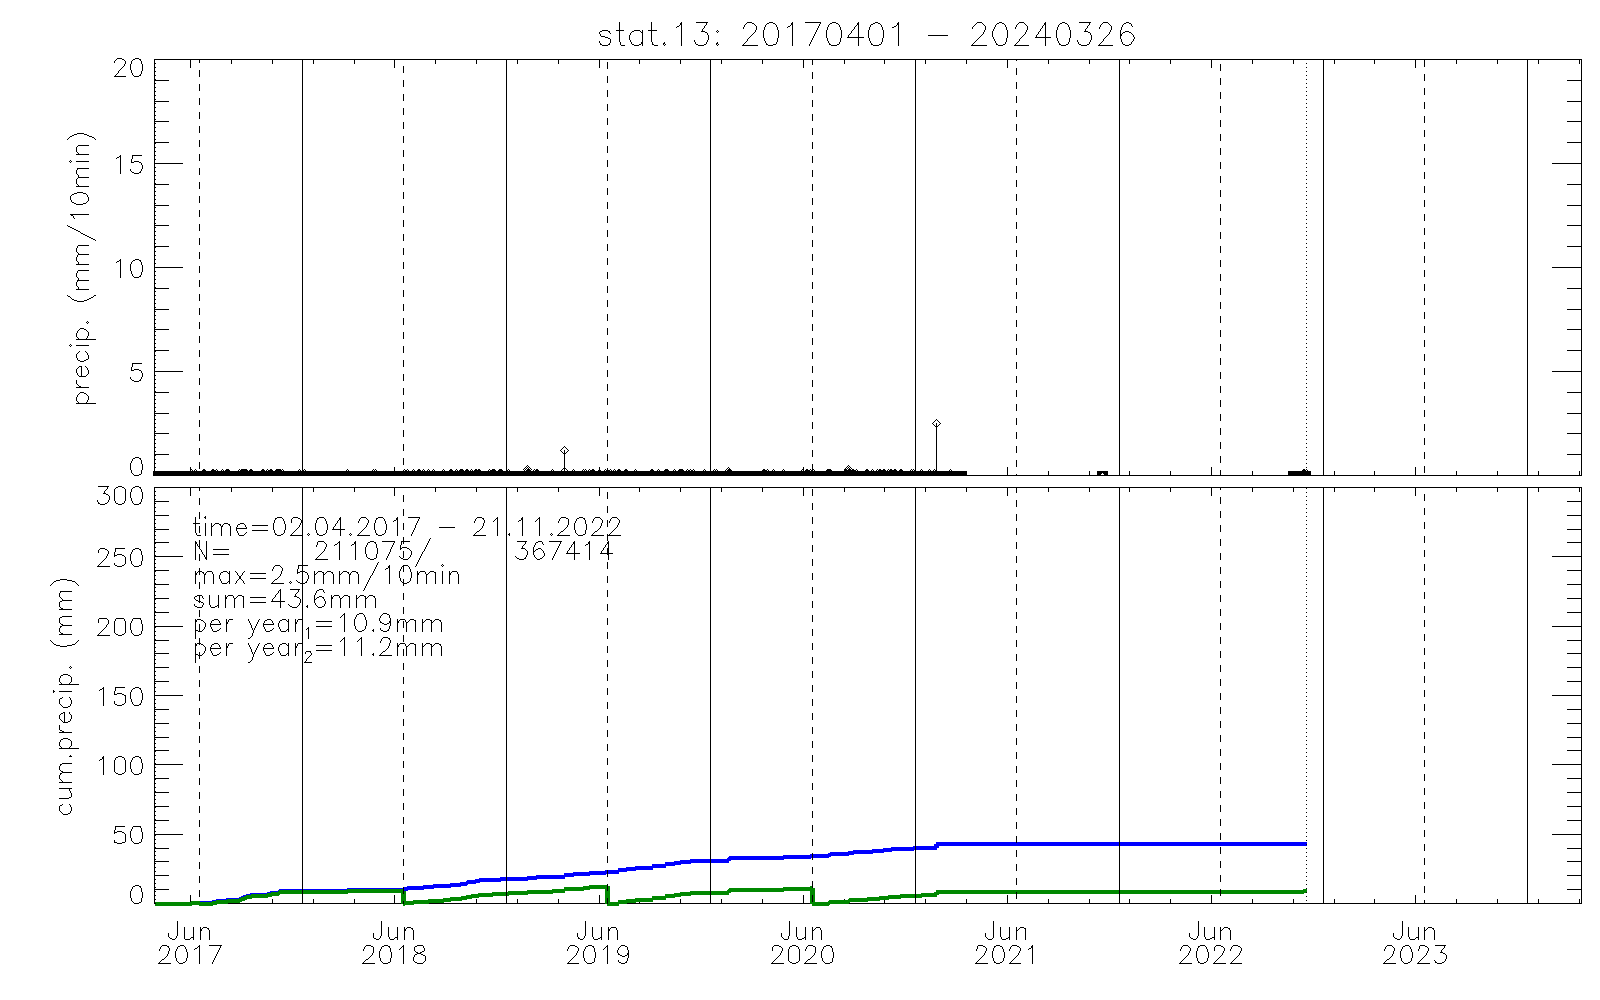
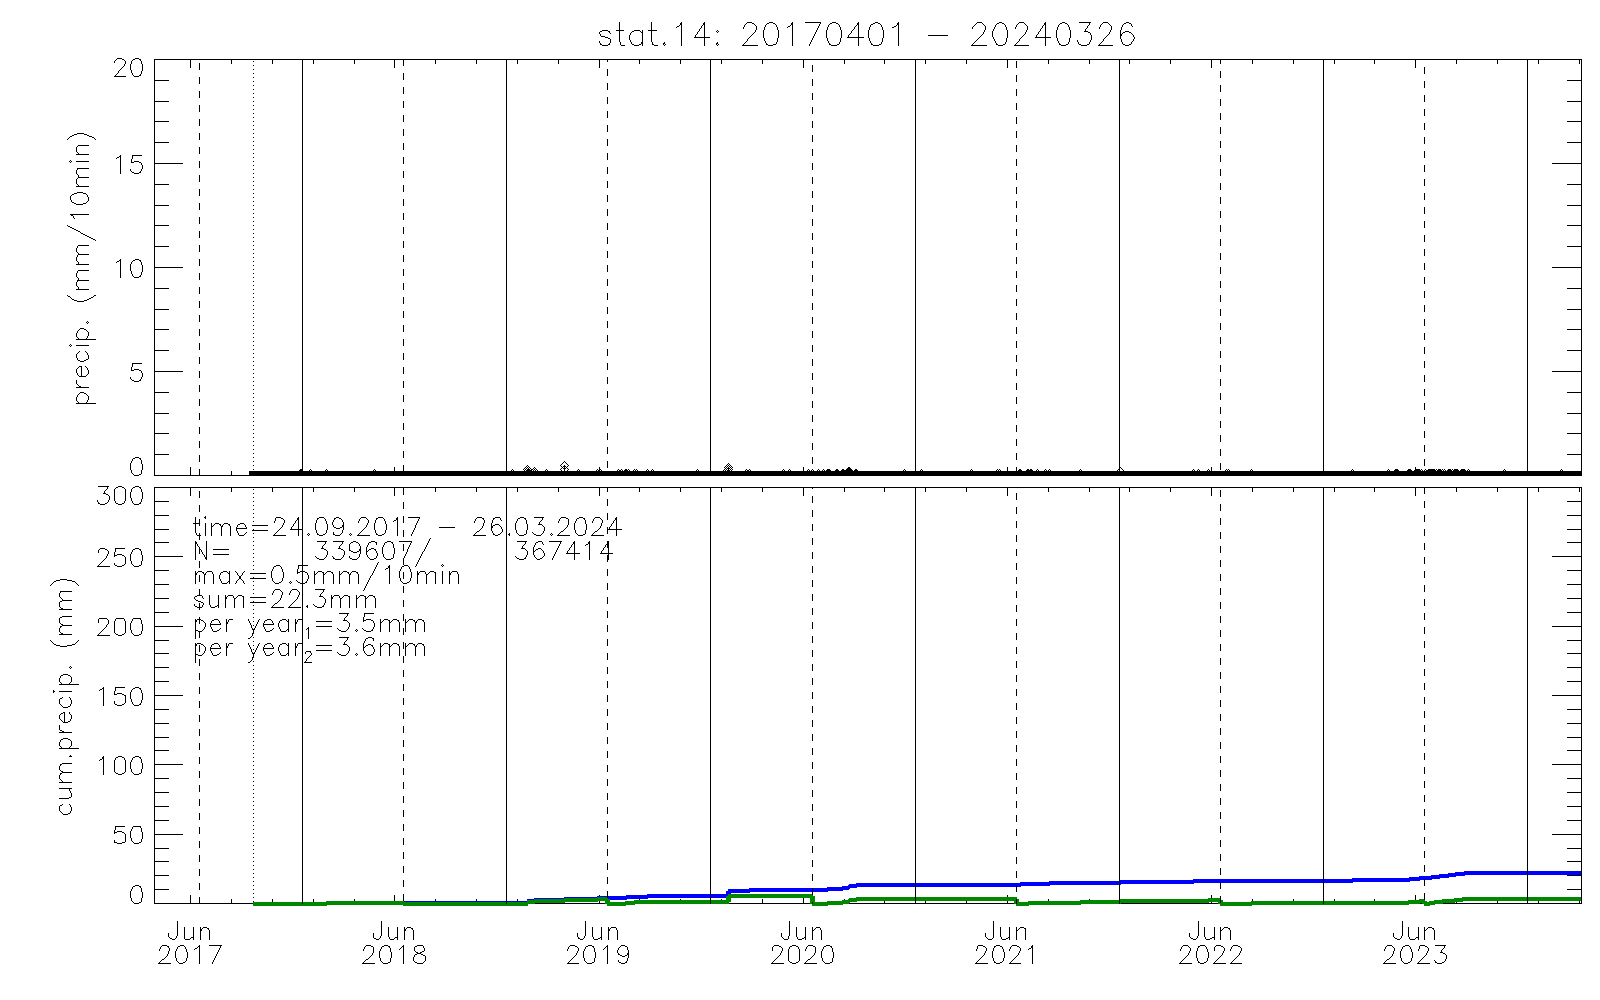
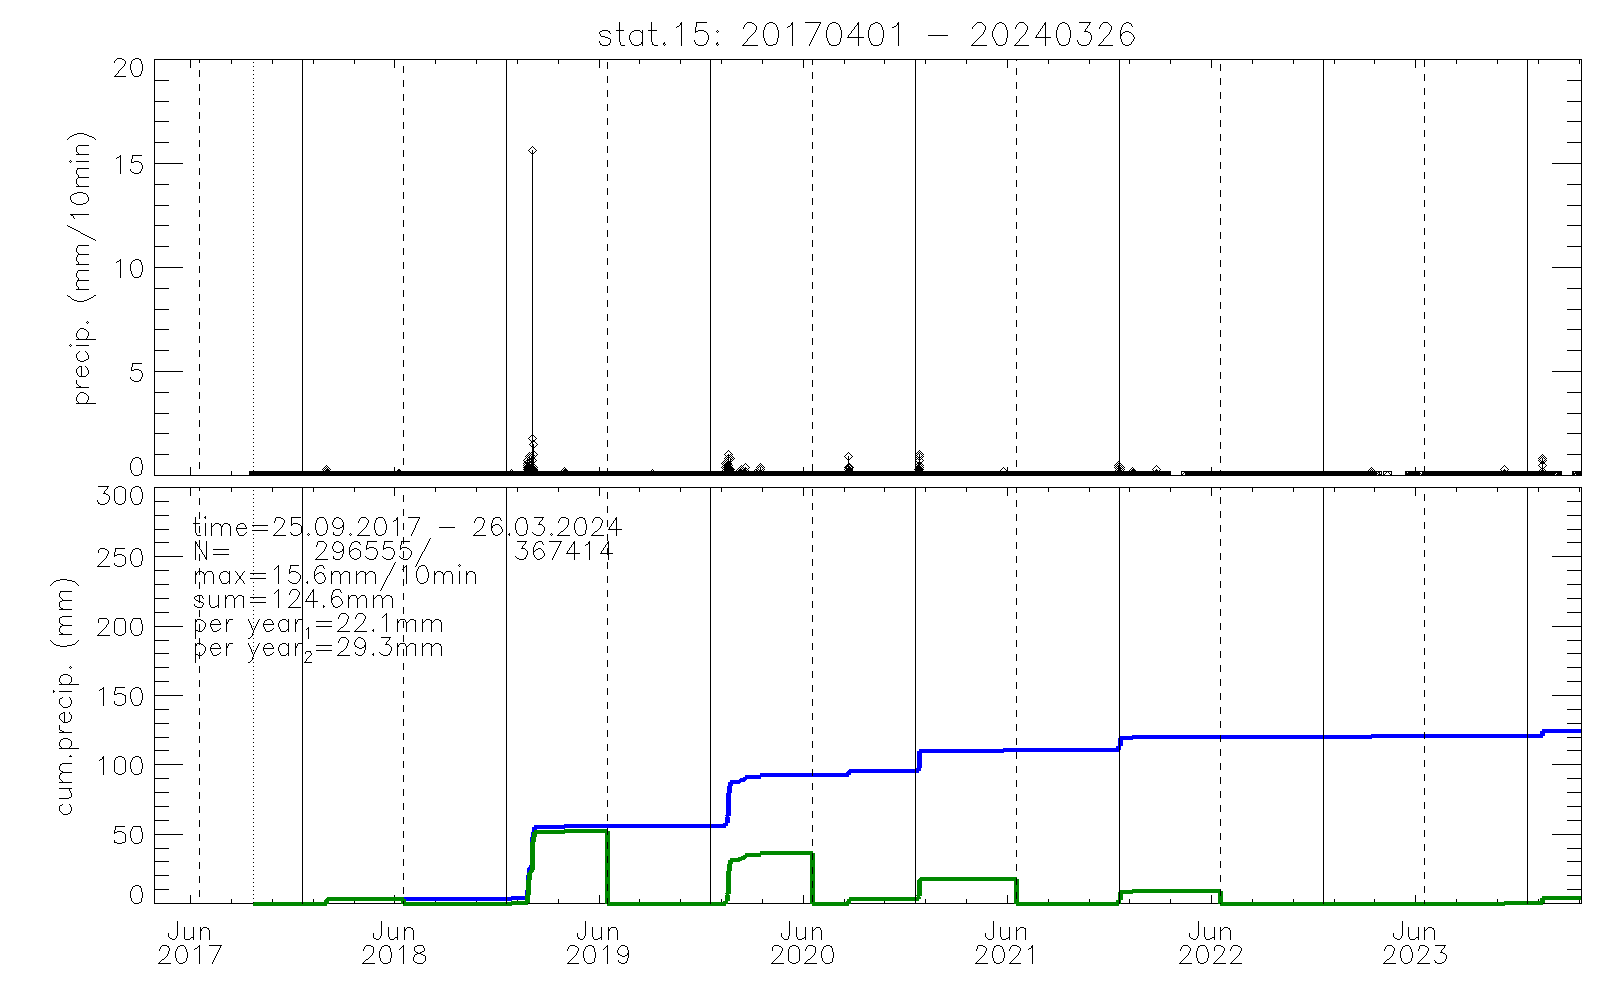
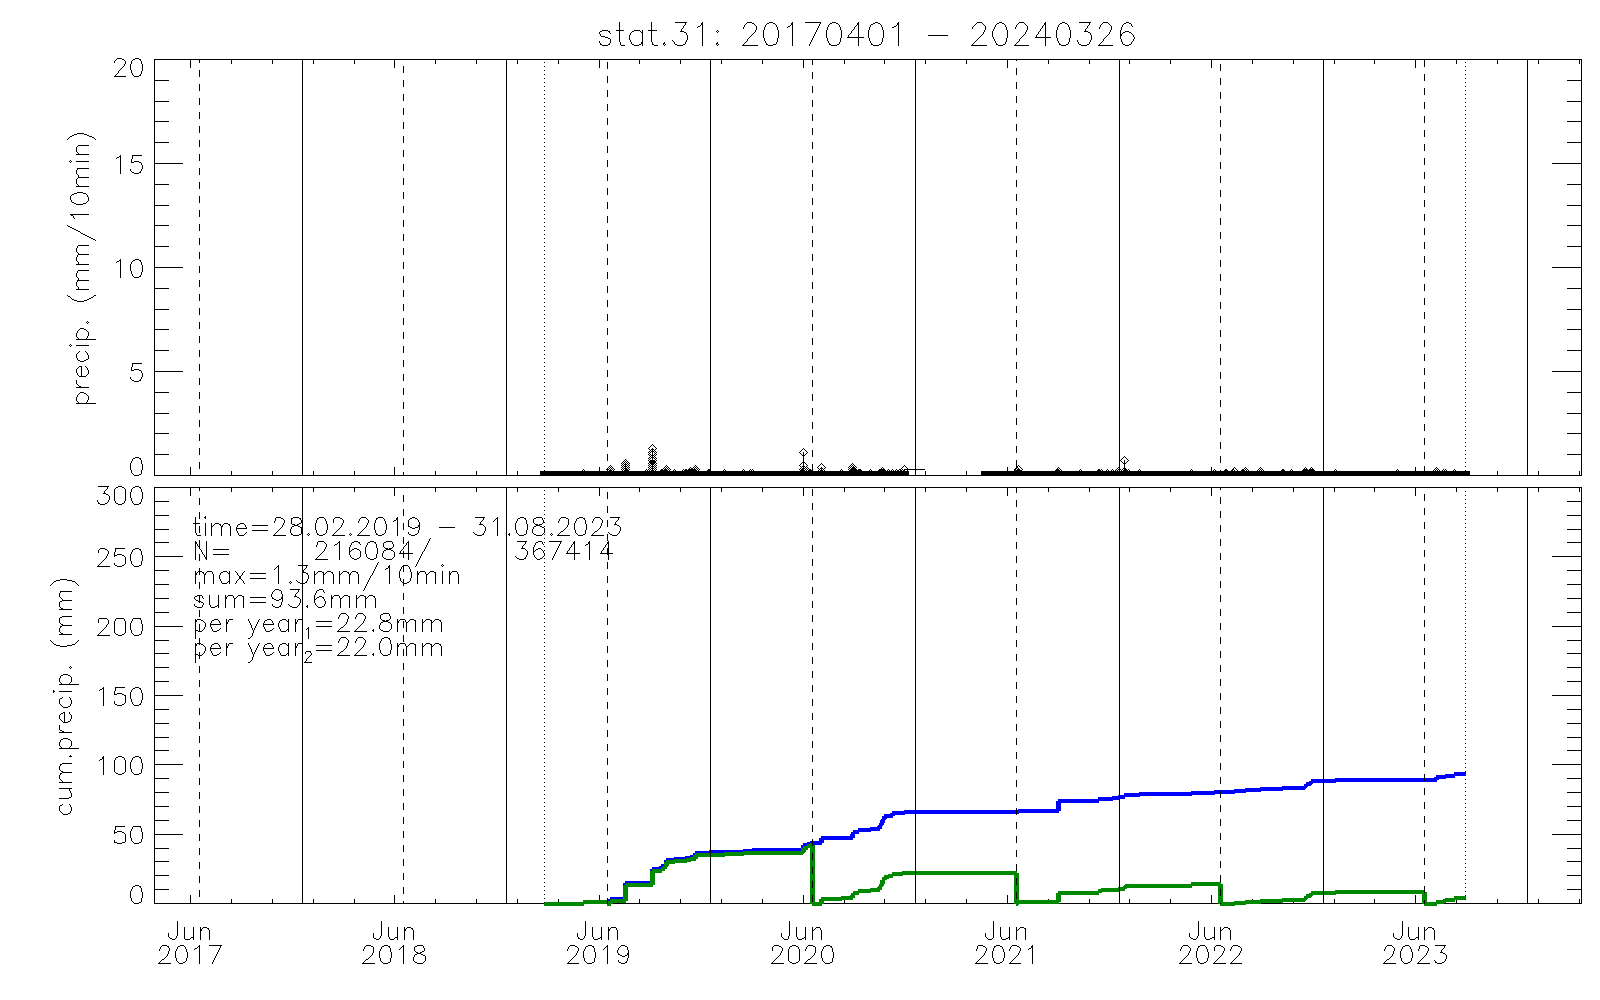
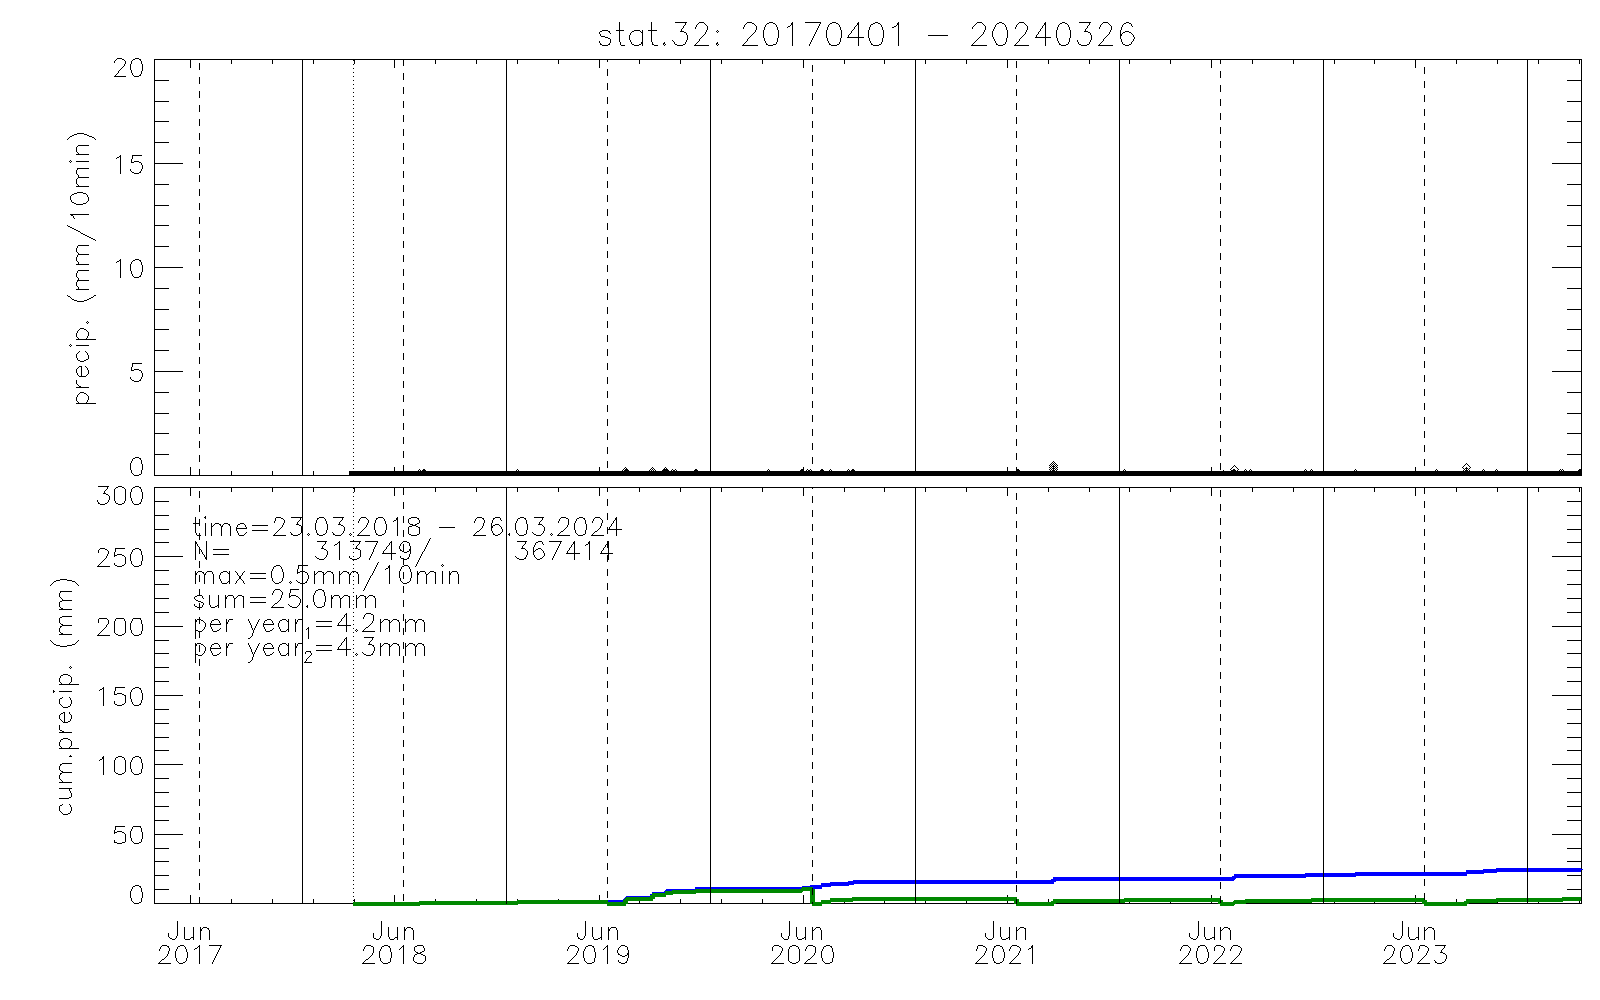
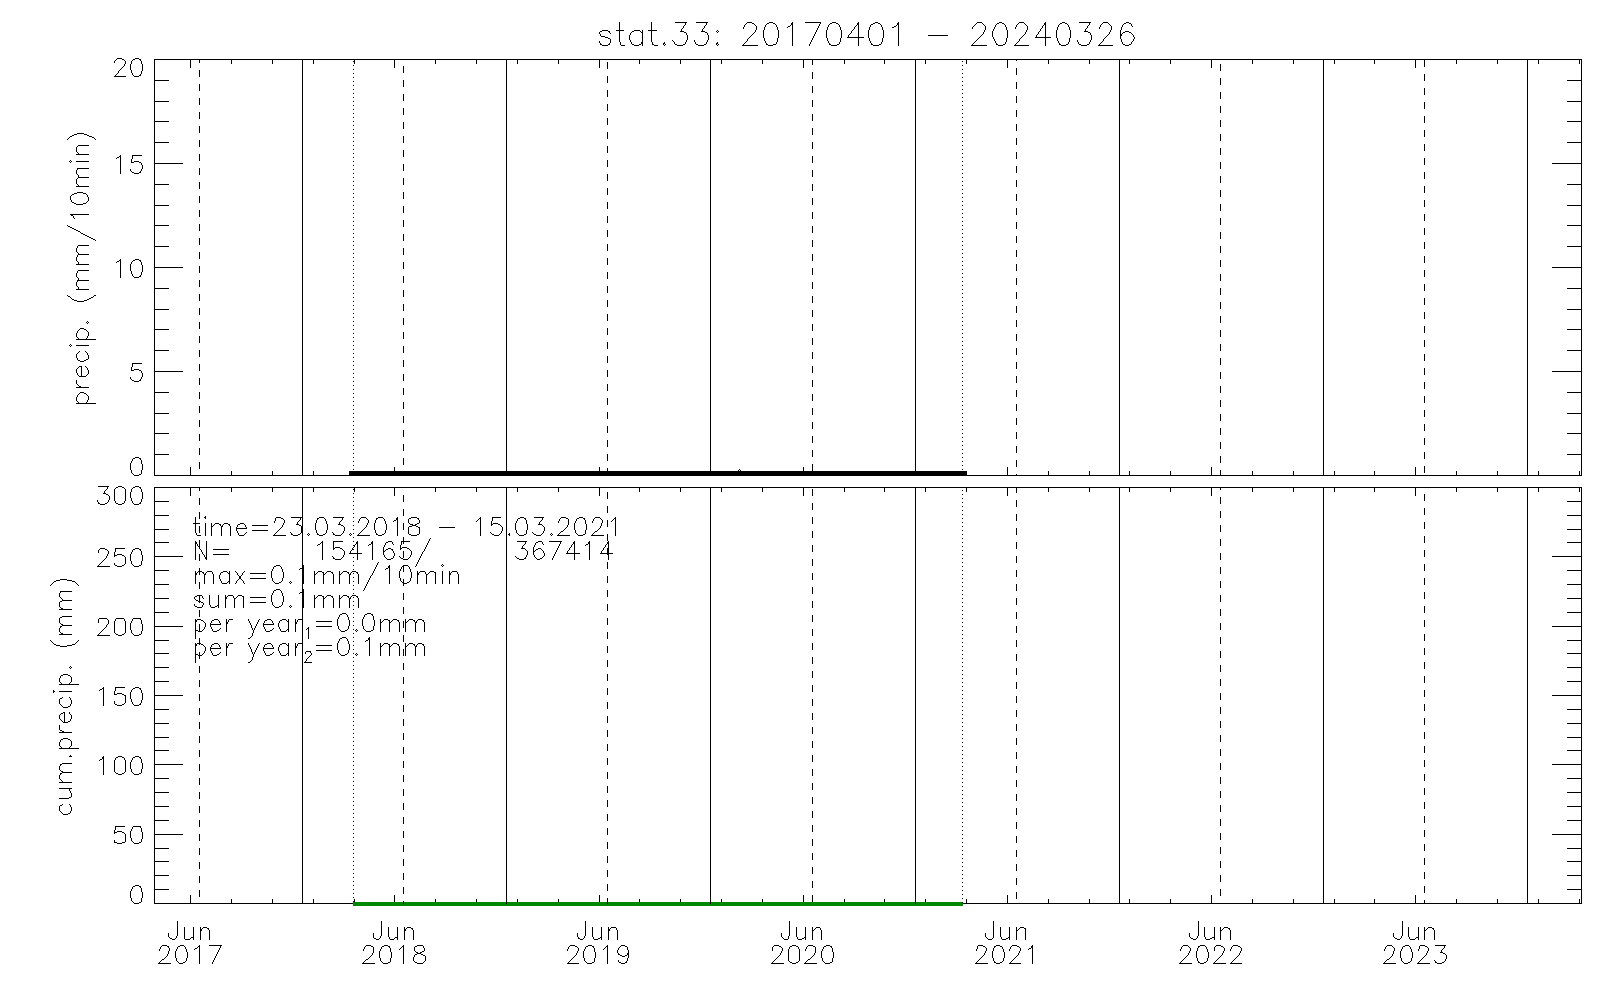
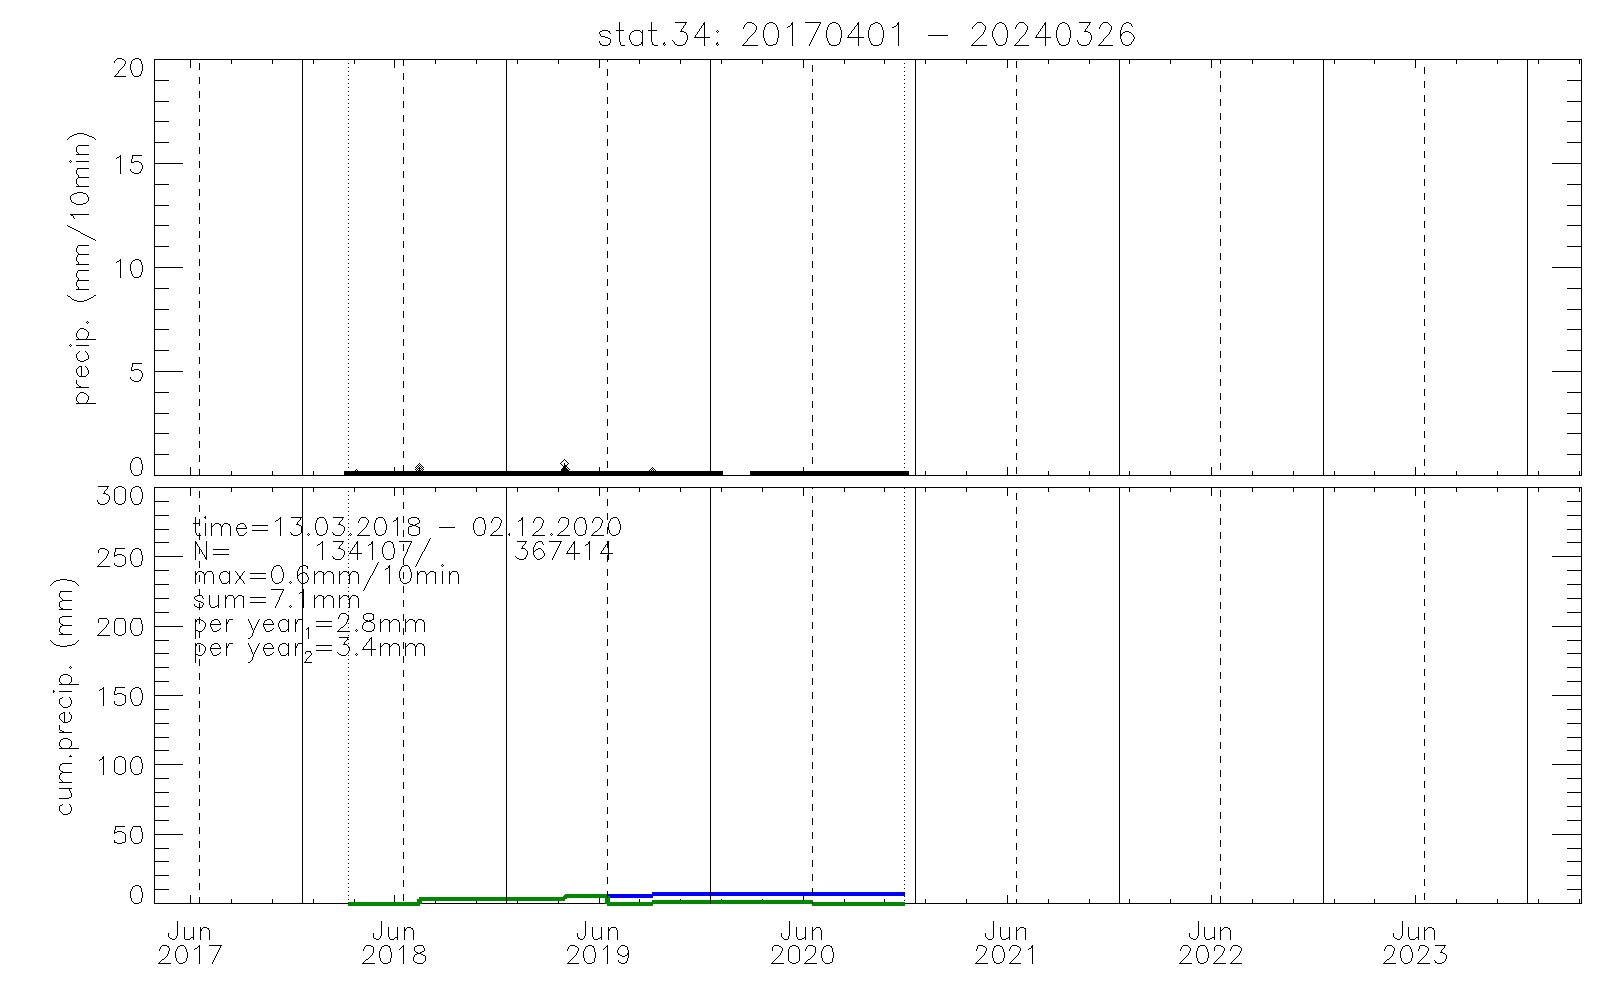
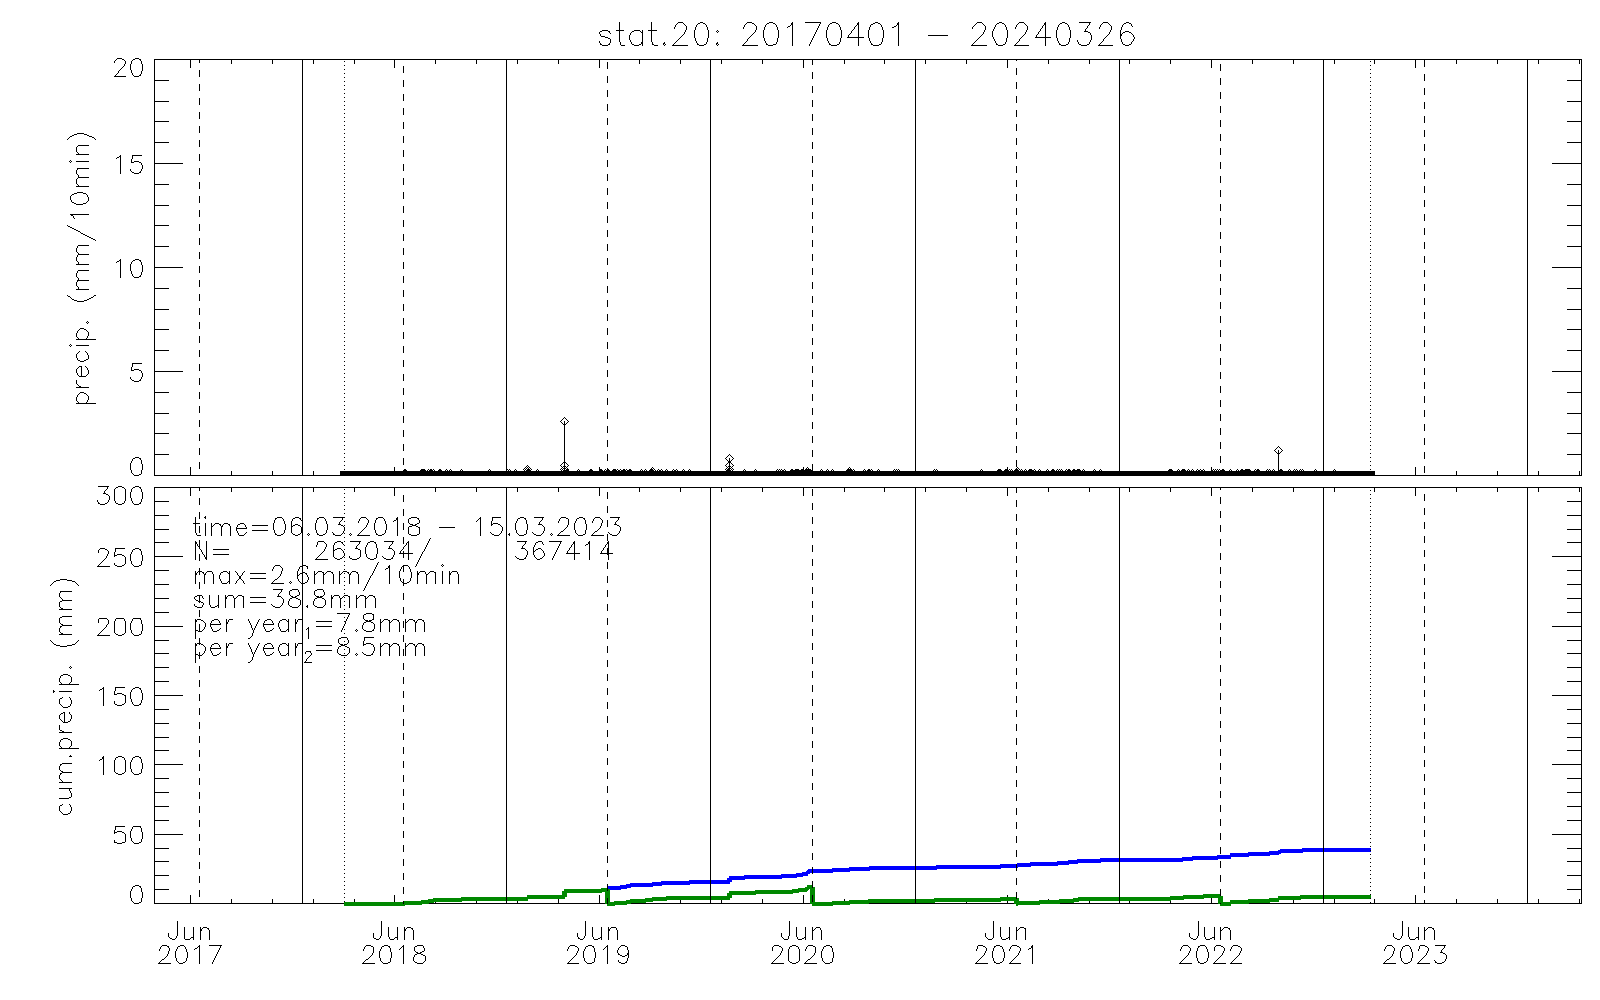
All currently availlable precipation data from the Dry Limit station network:
Top = recorded precipation per 10minutes.
Bottom = total cumulative precipitation (blue), and cumulative precipitation beween winter solistices (green).
Vertical lines mark solisitces in winter (dashed) and summer (solid) and begin and end of dataset (dotted).
Precipitation per year comes as averages over all data (subscript 1) and average over complete year sums only (subscript 2).