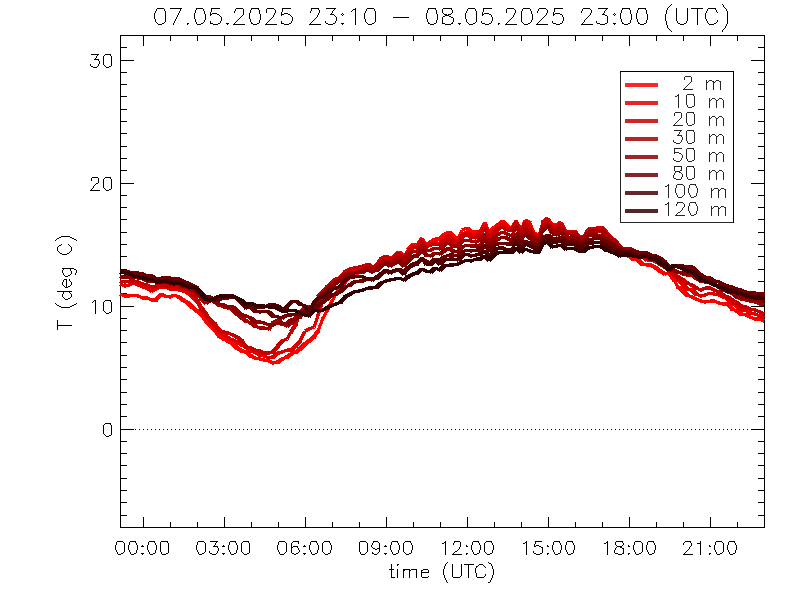
Air temperature
For information about the tower you look better at our wiki or our internal wiki pages
Below you find raw plots of the last available date. For daily plots have a look at the Quick look browser
Air temperature
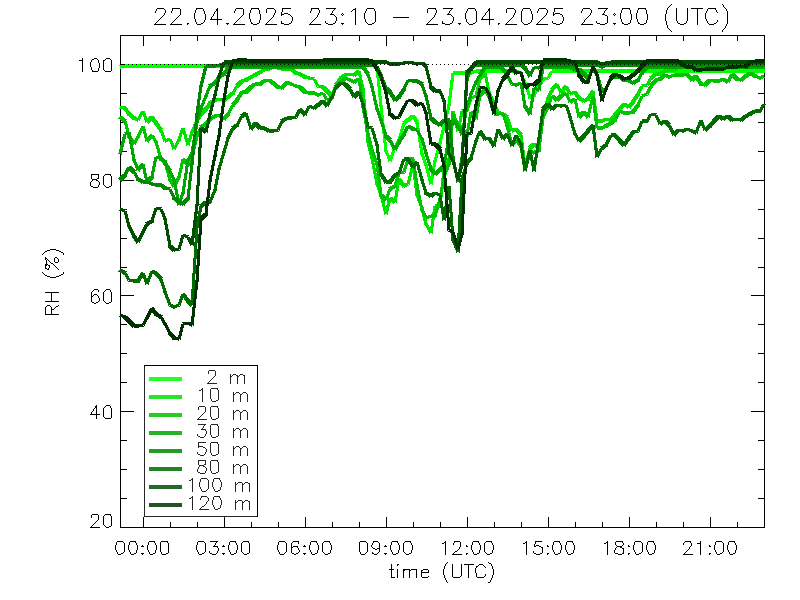
Relative humidity.
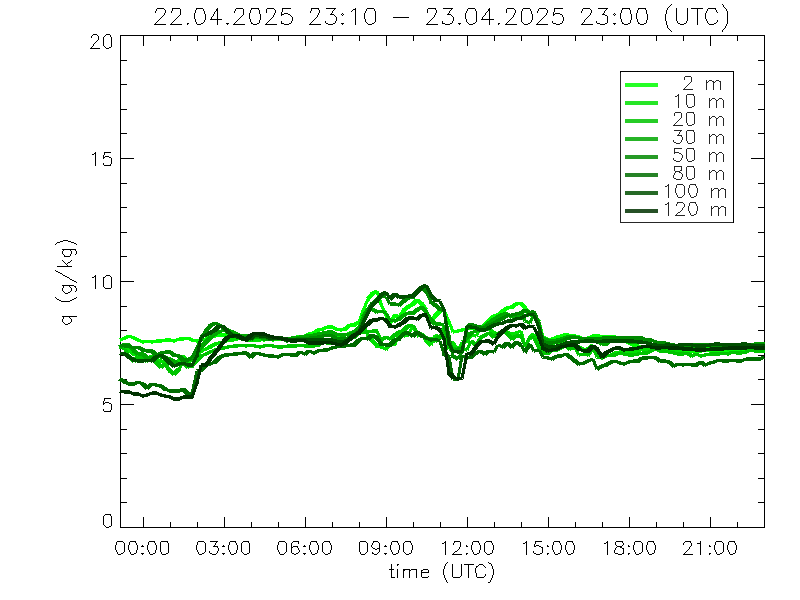
Specific humidity = water vapour mass mixing ratio.
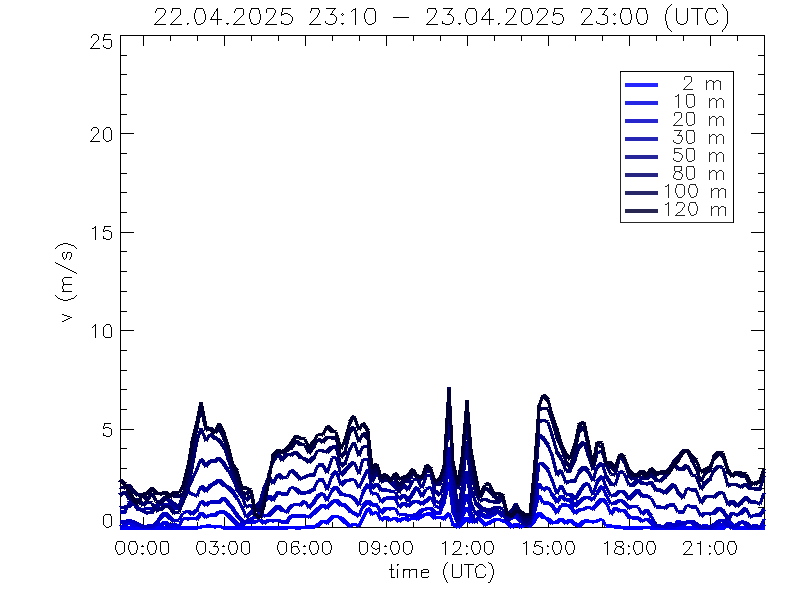
Wind speed.
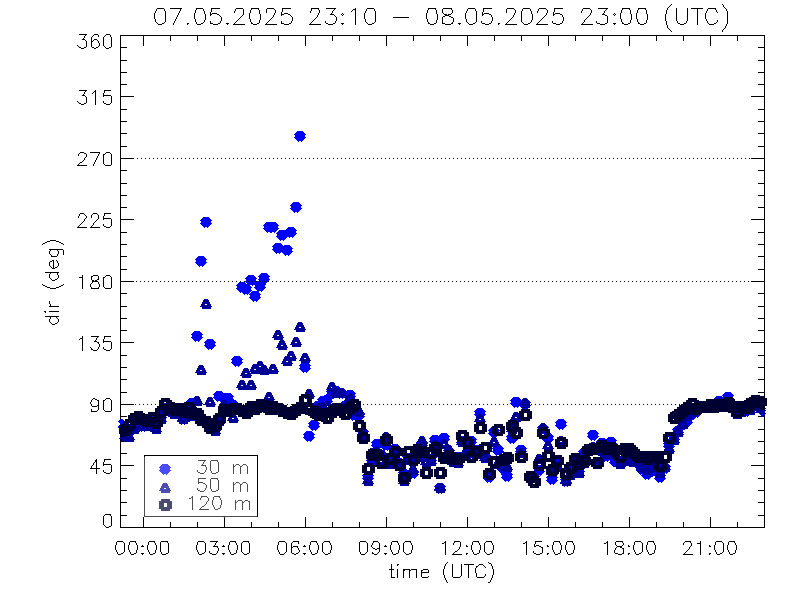
Wind direction.
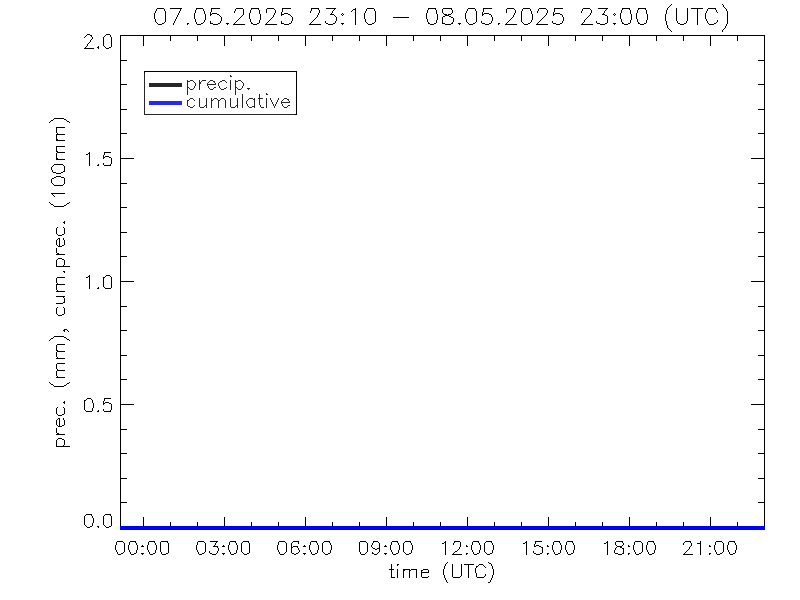
Precipitation.
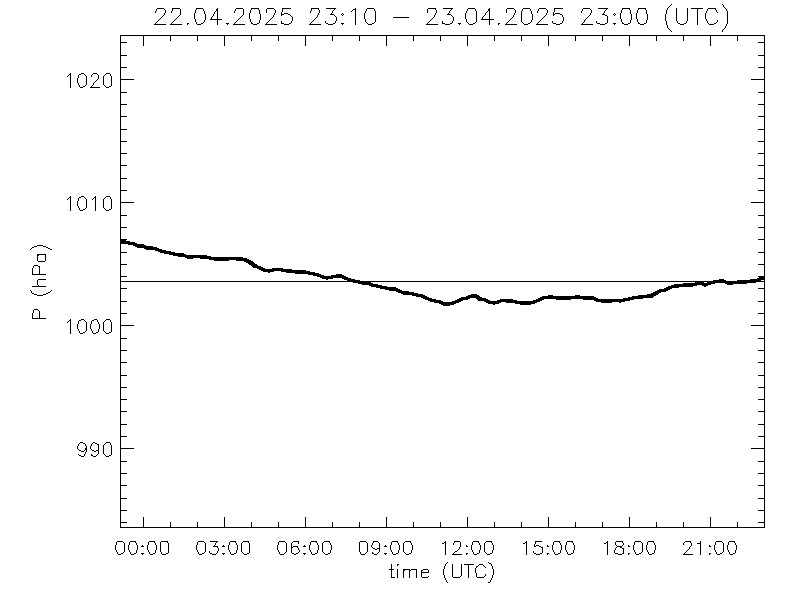
Pressure.
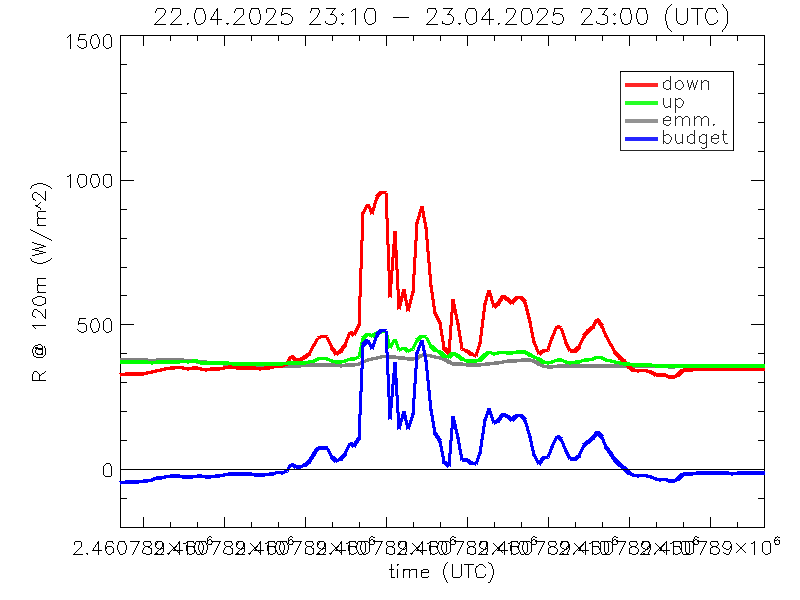
Up- and down-welling radiation at 120m. !!! ATTENTION: rad_up is defect !!!
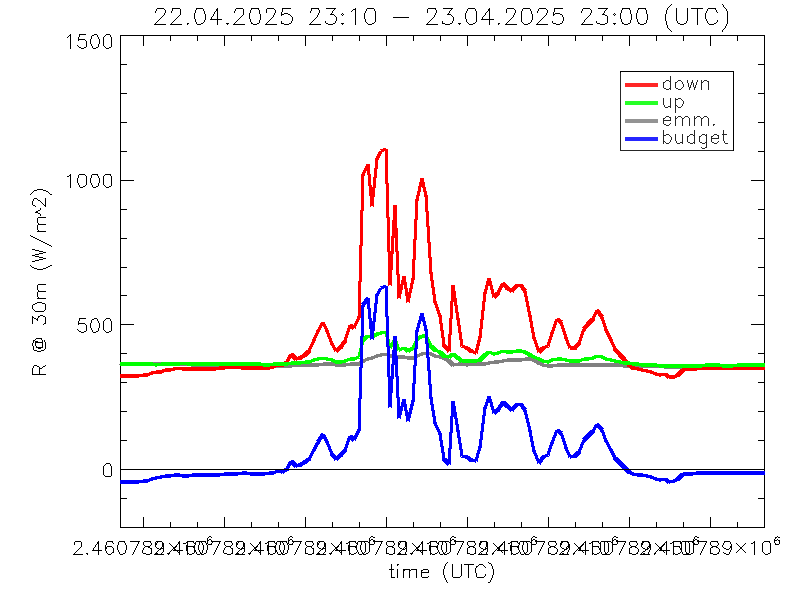
Up and down welling radiation at 30m.
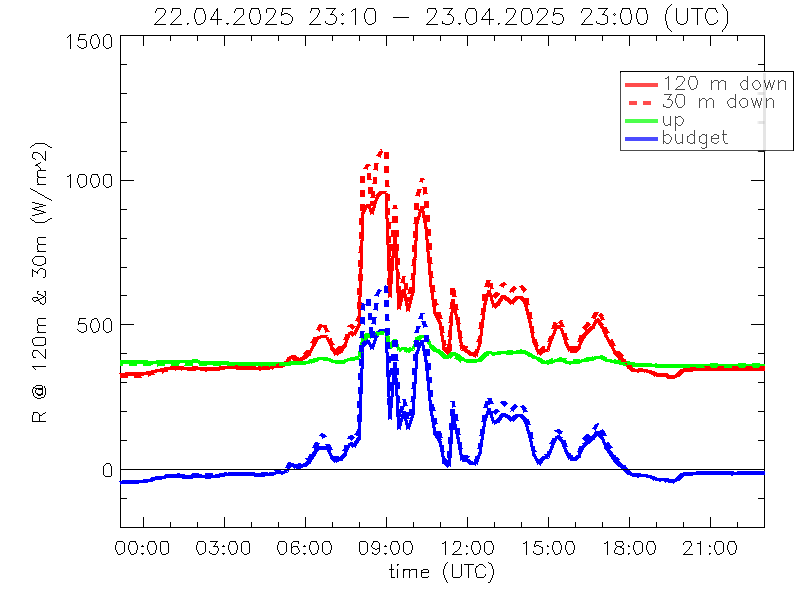
Up and down welling radiation at 120m (solid) and 30m (dashed).
Animation of Profiles from the tower, you see:
temperature (thick red line), wind (thick blue line), water vapor mixing ratio (thick green line),
and radiative fluxes of up- (green boxes on the right),
and downwelling- (red) radiation (full spectrum) and the radiative net flux (blue).
Thin colored lines are fits of profiles according to Monin Obukhov theory.
The larger square at 30m is the maximum gust measured at this height.
The green dashed line ist the vapor mixing ratio at saturation (100% rel. humidity).
The dashed horizonal green line at 20m marks roughly the height of tree tops.
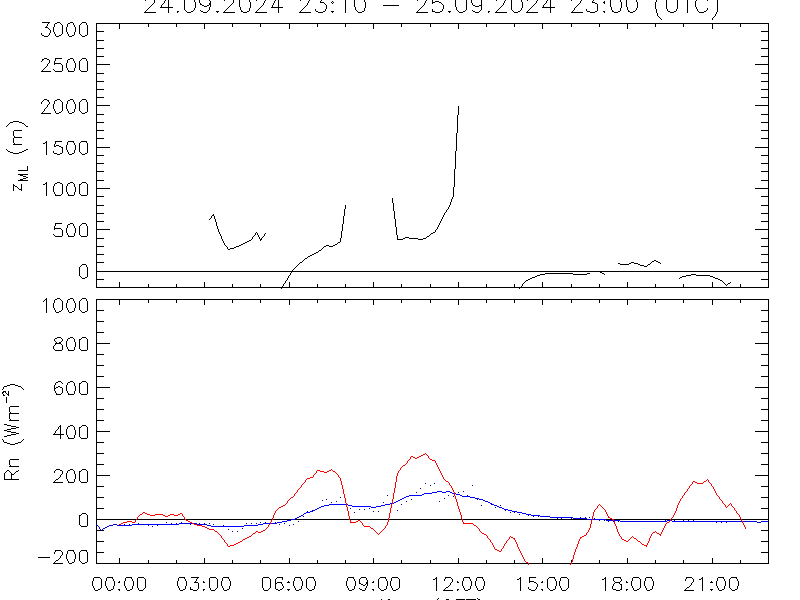
Estimated bounday layer height (black) from net radiation (blue) and heating rate (red).
Assuming no advection it should be Rn-G = ro cP dT/dt h , thus height of the BL should be
equal to the ratio of available energy to heating rate.